Programming with Python › Python Setup and First Programs › Day 48
Day 48: Reading Error Messages and Debugging
After this lesson you will be able to read any Python traceback bottom-up, recognize the common exceptions on sight, and work through a bug with a calm, repeatable method instead of guessing.
Hands-on lab for this lesson
Lab files on GitHub: https://github.com/ai-roadmap-365/ai-roadmap-365.github.io/tree/main/labs/sections/programming-with-python/day-048-reading-error-messages-and-debugging
- Get the hands-on files. Clone the labs repository once (you can reuse this clone for every lesson). This works on macOS, Linux, and Windows (PowerShell or WSL):
git clone https://github.com/ai-roadmap-365/ai-roadmap-365.github.io.git cd ai-roadmap-365.github.io - Open this lesson's lab. Move into the directory for this specific day. Every lab lives at the same predictable path — section / subsection / week / day:
cd labs/sections/programming-with-python/day-048-reading-error-messages-and-debugging - Read the lab guide. Open `README.md` in that directory. It lists the exact commands, what each does, the expected output, and how to check your work — read it before running anything.
- Run it and check your work. Follow the README's "How to run" section: run the example first to see the finished result, then complete the numbered exercises in `starter/`, then run the tests. The tests pass (exit 0) only when your work is correct.
bash tests/run_tests.sh # or the test command named in the lab README
You can also open the lab as a local page (works offline, shows the file tree and expected output).
Learning objectives
By the end of this lesson you will be able to:
- Read a Python traceback from the bottom up: identify the exception type and message, then the culprit frame with its file, line number, and function
- Recognize the common built-in exceptions (SyntaxError, IndentationError, NameError, TypeError, ValueError, IndexError, KeyError, AttributeError, ModuleNotFoundError, ZeroDivisionError) and state what each really means
- Distinguish confusable pairs — TypeError vs ValueError, and IndexError vs KeyError — and use the exception type to point at the right fix
- Apply the six-step debugging method: reproduce, read, isolate, hypothesize, test, fix
- Use print-debugging well and pause a running program with breakpoint()/pdb to step through and inspect variables
- Explain why the line named in an error is not always where the bug is, and know when to climb the call stack
- Connect calm, methodical debugging to AI practice, where models, data, and dependencies raise these same exceptions
Prerequisites
- Days 43-47: Python installed, and comfort writing and running small programs with variables, strings, numbers, and input/output
- A terminal and a text editor; no prior debugging experience required
Why this matters
For the last five days you have written Python that mostly worked. Starting now — and for the rest of your career — most of the code you run will fail before it succeeds. That is not a sign you are doing it wrong. It is the normal texture of programming: you write a few lines, run them, read what the machine says, and adjust. The single skill that most separates people who move fast from people who get stuck is not writing flawless code the first time. It is reading a failure calmly and knowing exactly what to do next.
This matters directly for the AI work ahead of you. When you load a dataset and it is missing a column, Python raises a KeyError. When you feed a model a list where it expected an array, you get a TypeError. When a dependency is not installed in your environment, you get a ModuleNotFoundError. When a downloaded file is truncated, an index runs off the end and you get an IndexError. The libraries you will lean on — the ones that train models and wrangle data — do not hide these errors; they surface them through the very same traceback you will learn to read today. An engineer who reads a hundred-line traceback and finds the one line that matters in ten seconds will iterate ten times faster than one who panics and starts changing things at random.
So today we reframe the whole activity. An error message is not the machine scolding you. It is the machine handing you a detailed report of exactly what went wrong and where — often the most useful information you will get all day. The goal is to stop flinching at red text and start reading it, the way a doctor reads a chart: symptom first, then the trail back to the cause. Once you can do that, nothing your program does will feel like a mystery for long.
The idea in plain language
When Python cannot carry out an instruction, it stops and raises an exception — a signal that something exceptional happened and normal execution cannot continue. An exception has a type (like ValueError or KeyError) that categorizes what went wrong, and usually a short message with the specifics. If nothing in your program catches that exception, Python prints a traceback — a report of where the failure happened — and exits.
A traceback looks intimidating because it can be long, but its structure is simple and always the same. The last line names the exception type and its message: this is what went wrong. Above it, the traceback lists the chain of function calls that led to the failure — which function was running, which function called it, and so on back to the top of your program. This chain is the call stack, and each entry in it is a stack frame: one function’s place in the story, complete with the file name, the line number, and the exact line of code being run when things broke.
The one habit that makes tracebacks readable is this: read from the bottom up. The bottom line tells you the kind of problem. The line just above the bottom tells you where in your code it surfaced. Only if that is not enough do you climb further up the stack. Most beginners read top-down, drown in library internals, and give up; you will read the punchline first, then work backward exactly as far as you need to. That single reversal turns a wall of text into a precise set of directions.
Historical background
Errors and exceptions are older than Python. Early programs simply crashed — or worse, kept running with corrupt data. The idea of a structured exception that a program could raise and, optionally, catch and handle grew through languages of the 1970s and 1980s; by the time Guido van Rossum released the first version of Python in 1991, exceptions were a designed-in, central feature rather than an afterthought. In Python, raising and catching exceptions is not an emergency mechanism reserved for disasters; it is a normal part of how the language communicates, used everywhere from a missing dictionary key to the end of a loop over a file.
The traceback — the printed record of the call stack at the moment of failure — is Python’s way of turning an invisible internal state into something you can read. The phrase it prints at the top, Traceback (most recent call last):, is itself a reading instruction that has stayed stable for decades: the calls are listed oldest first, so the most recent call — the one nearest the actual error — sits at the bottom, right above the exception. Recent versions of Python have made these reports even more helpful: since Python 3.11, released in 2022, tracebacks can underline the exact sub-expression on a line that caused the error, so a failure inside a[i] + b[j] points a caret at the specific piece that broke.
Interactive debugging has a similarly long lineage. Python has shipped a built-in debugger, pdb, since its early days — a tool that lets you pause a running program and inspect it line by line. For years, starting the debugger meant importing pdb and calling a slightly awkward incantation. Python 3.7, released in 2018, added the built-in breakpoint() function through PEP 553, giving you one memorable word to drop into any line where you want the program to stop so you can look around. The tools have grown friendlier, but the underlying idea has not changed since the first computers: when you cannot see what a program is doing, make it stop and tell you.
What it is — and what it is not
Debugging is the systematic process of finding and fixing the cause of a program’s incorrect behavior. Reading error messages is the first and most common part of it, because a large fraction of bugs announce themselves with an exception and a traceback that points almost directly at the problem. Every word of that definition earns its place. Systematic: debugging is a method, not a mood — a repeatable loop you can run whether you feel clever today or not. Cause: the aim is the underlying reason, not the surface symptom. Incorrect behavior: sometimes the program crashes, and sometimes it runs happily while producing the wrong answer — both are bugs, though only the first hands you a traceback.
It helps just as much to be clear about what debugging is not. It is not guessing. It is not changing lines until the error goes away and hoping you did not break something else. It is not a judgment of your worth as a programmer — professionals with decades of experience spend a large share of every day debugging, because writing new code always outruns the mind’s ability to foresee every case. And an error message is emphatically not a punishment. The most damaging misconception a beginner can hold is that seeing red text means failure; in truth, a clear exception is the machine doing you an enormous favor by telling you precisely what it could not do and where.
| Common misconception | The reality |
|---|---|
| ”An error means I failed.” | An error is diagnostic information; it tells you exactly what to fix next. |
| ”I should read the traceback from the top.” | Read it bottom-up: the exception type and the nearest frame matter most. |
| ”The bug is on the line in the error.” | That is where the error surfaced; the cause is often a few lines — or frames — earlier. |
| ”Debugging is guessing until it works.” | Debugging is a systematic loop: reproduce, read, isolate, hypothesize, test, fix. |
| ”Good programmers do not get errors.” | Good programmers get errors constantly and read them fast; that speed is the skill. |
Why it was created and what problems it solves
Exceptions and tracebacks exist to solve a problem that plagued early programming: silent, undiagnosable failure. Without them, a program that hit an impossible situation had two bad options — stop dead with no explanation, or blunder onward using garbage values, so the mistake surfaced much later, far from its cause, as a wrong answer nobody could trace. Either way the programmer was left guessing. The structured exception fixed the first problem: when something goes wrong, the program stops at the point of failure and reports the type of problem in a controlled way. The traceback fixed the second: it captures the full chain of calls that led to that point, so the report arrives with a map back to the origin.
The debugger solves a different but related problem. A traceback is a single snapshot taken at the instant of a crash, which is perfect when the program crashes but useless when it runs to completion with a wrong result, or when you simply cannot tell why a variable holds the value it does. For those cases you need to see the program while it is alive — to freeze it mid-run and inspect the values of variables at that exact moment. That is what pdb and breakpoint() provide: a way to pause execution and look inside, instead of reconstructing events after the fact. Together, exceptions, tracebacks, and the debugger cover the whole territory: they make failure loud, they make it locatable, and they make the living program inspectable. Every one of these is something you will reach for constantly once your programs — and your AI experiments — grow past a few dozen lines.
How it works
Let’s walk through the two things you must be able to do: read a traceback, and debug methodically.
Reading a traceback, bottom to top
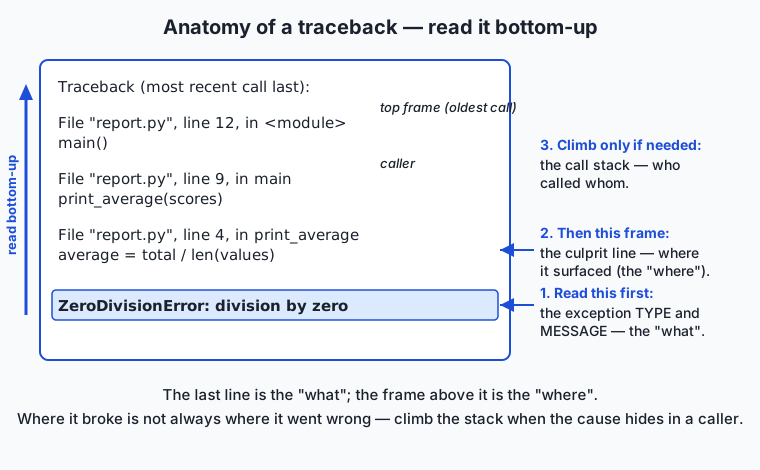
Suppose you run a small program and Python prints this:
Traceback (most recent call last):
  File "report.py", line 12, in <module>
    main()
  File "report.py", line 9, in main
    print_average(scores)
  File "report.py", line 4, in print_average
    average = total / len(values)
ZeroDivisionError: division by zero
Read the last line first: ZeroDivisionError: division by zero. That is the what — the type of problem (a division by zero) and its message. You now know the category of the bug before reading anything else.
Now move to the frame directly above the exception, the bottom-most File block: File "report.py", line 4, in print_average, and under it the exact line of code, average = total / len(values). This is where the error surfaced — line 4, inside the function print_average. Ninety percent of the time, this is all you need: you can see that len(values) was zero, so values was an empty list.
The frames above are the call stack, read as a story from the bottom up: print_average was running (bottom frame); it was called by main at line 9 (next frame up); and main was called at line 12 at the top level of the file, shown as <module> (top frame). Each frame is one function’s place in the chain, with its file, line number, function name, and the line it was executing. You climb this stack only when the bottom frame is not enough — for instance, when the empty list was created far away and you need to find out which caller passed it in.
The common exceptions and what each really means
Most everyday failures are one of a small set of exception types. Learning what each one really means — the underlying situation, not just the name — lets you jump almost instantly from the last line of a traceback to the kind of fix required.
| Exception | What it really means | Tiny example that raises it |
|---|---|---|
SyntaxError | Python could not parse your code; it is not valid Python. | print("hi" (missing )) |
IndentationError | A special SyntaxError: indentation is wrong or inconsistent. | a line indented when it should not be |
NameError | You used a name that does not exist (typo, or used before defined). | prnit("hi") |
TypeError | An operation got a value of the wrong type. | "3" + 5 |
ValueError | The type is right but the value is unacceptable. | int("hello") |
IndexError | A sequence index is out of range. | [1, 2, 3][5] |
KeyError | A dictionary key does not exist. | {"a": 1}["b"] |
AttributeError | An object has no such attribute or method. | "hi".apend("x") (typo for append) |
ModuleNotFoundError | Python cannot find a module to import. | import nonexistent_module |
ZeroDivisionError | You divided by zero. | 1 / 0 |
Two pairs are worth pinning down because beginners confuse them. TypeError versus ValueError: a TypeError means the kind of thing is wrong — you tried to add a string to a number, and no value would have made that operation valid. A ValueError means the kind of thing is right but this particular value is not — int("42") works, but int("hello") raises ValueError because a string is the right type for int(), yet “hello” is not a number. And IndexError versus KeyError: both mean “I looked something up and it was not there,” but IndexError is for positions in an ordered sequence (a list or tuple index), while KeyError is for named lookups in a dictionary.
The systematic debugging method
When the traceback alone does not hand you the fix — or when the program produces a wrong answer without crashing — you switch from reading to investigating, using a repeatable six-step loop.
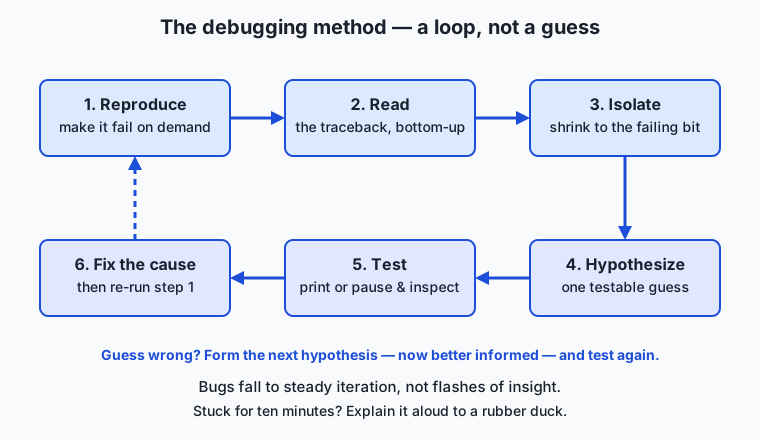
- Reproduce. Get the failure to happen on demand. A bug you cannot trigger reliably is a bug you cannot fix with confidence, because you will never know whether you fixed it. Note the exact command and inputs that cause it.
- Read. Read the error and the traceback carefully, bottom-up, exactly as above. Note the exception type, the file, the line, and the function.
- Isolate. Narrow down where the problem lives. Cut the program down, or add checks, until you have the smallest piece that still fails. A bug in ten lines is far easier to see than the same bug in a thousand.
- Hypothesize. Form one specific, testable guess about the cause — “the list is empty because the file had no data rows” — not a vague “something’s wrong with the loop.”
- Test. Check the hypothesis. Print the suspect value, or pause in the debugger and look. Either the guess is confirmed or it is ruled out; both outcomes are progress.
- Fix. Change the cause, not the symptom, then re-run your reproduction from step 1 to confirm the failure is gone — and that you have not created a new one.
The loop is the point. If a hypothesis is wrong, you do not despair; you form the next one, now better informed. Bugs fall to steady iteration far more reliably than to flashes of insight.
Print-debugging and the interactive debugger
The simplest way to test a hypothesis is to make the program tell you what it is doing. Print-debugging means adding temporary print() calls to reveal values and control flow: print(f"scores = {scores!r}") right before the failing line shows you exactly what scores held. Done well, print-debugging is fast and honest: label each print so you know which one fired (print("A:", x)), print the repr with !r so you can tell "3" from 3, and remove the prints once the bug is found so they do not clutter the code or leak into output. Its weaknesses are that you must edit, re-run, and guess in advance what to print — and you often discover you printed the wrong thing.
The interactive debugger removes that guesswork by letting you pause the living program and look around freely. Drop the built-in breakpoint() function on any line, and when Python reaches it the program stops and gives you a (Pdb) prompt where you can type commands: p scores prints a variable, n runs the next line, s steps into a function call, c continues until the next breakpoint or the end, l lists the code around you, and q quits. Because you are inside the paused program, you can inspect any variable in scope, evaluate expressions, and walk forward one line at a time watching values change — no re-running, no guessing what to print. Since Python 3.7, breakpoint() is the one-word way in; the older import pdb; pdb.set_trace() does the same thing and still appears in lots of code.
Rubber-duck debugging, and when the error is not where it says
Sometimes the most effective tool is your own voice. Rubber-duck debugging is the practice of explaining your code, line by line and out loud, to an inanimate object — traditionally a rubber duck on your desk. It works because articulating what each line is supposed to do forces you to compare intent against reality, and the mismatch — the place where “this should hold the scores” meets “but I never actually filled it” — usually reveals itself the moment you say it aloud. You do not need the duck; a patient colleague, a written explanation, or a quiet monologue all work.
Finally, a crucial subtlety: the line named in the error is where the program broke, which is not always where it went wrong. A ZeroDivisionError on total / len(values) is real, but the actual mistake may be fifty lines earlier where values was filled from a file that turned out to be empty. A KeyError when you read record["email"] is genuine, but the bug might be in the code that built record and forgot that field. This is why the call stack exists and why you sometimes climb it: the symptom appears at the bottom frame, but the cause can hide in a caller above, or in code that ran long before the crash. Keeping “where it broke ≠ where it went wrong” in mind is what stops you from fixing symptoms forever.
An everyday analogy
Think of debugging as detective work at the scene of an incident. When a program crashes, Python hands you a report much like a detective’s case file. The last line of the traceback is the coroner’s finding — the cause of death, stated plainly: “division by zero,” “no such key.” You read that first, because it tells you what kind of case you are working before you waste time on details.
The call stack above it is the timeline of the day, reconstructed witness by witness. Each stack frame is a witness statement: “I am the function print_average, I was on line 4 running average = total / len(values) when it happened, and I was sent here by main.” Read the timeline from the bottom — from the moment of the incident — and work backward through who called whom, exactly as a detective starts at the body and traces the events that led there. Most cases are solved at the scene, in the bottom frame; only the tangled ones require interviewing the earlier witnesses further up.
The rest of the method is ordinary detective procedure. You reproduce the crime to study it under controlled conditions. You isolate by narrowing the list of suspects until one piece of code remains. You form a hypothesis about the culprit and you test it against evidence rather than arresting on a hunch — and the debugger is your interview room, where you stop a suspect variable mid-run and ask it directly what value it is holding. Even the rubber duck fits: it is the partner you talk the case through with, the one who says nothing but in front of whom you suddenly hear the flaw in your own theory. Hold this scene in mind and error text stops being alarming; it becomes the most cooperative witness you will ever question.
Examples in practice
Start with a real traceback you can reproduce. Put this in a file and run it:
def print_average(values):
    total = sum(values)
    average = total / len(values)   # line 3
    print(f"Average: {average}")

scores = []
print_average(scores)
Running it prints a ZeroDivisionError whose bottom frame points at line 3. Read bottom-up: the what is division by zero; the where is total / len(values); and one glance shows len(values) is zero because scores is empty. The fix is to handle the empty case — if not values: print("No scores yet"); return — and note that the real cause was up in the caller, where scores was never filled.
Now watch the difference between two lookups. This raises IndexError: list index out of range:
scores = [88, 92, 79]
print(scores[3])     # valid indices are 0, 1, 2
The list has three items at positions 0, 1, and 2; asking for position 3 walks off the end. Compare it with this, which raises KeyError: 'Germany':
capitals = {"France": "Paris", "Japan": "Tokyo"}
print(capitals["Germany"])
Same shape of mistake — looking up something that is not there — but the exception type tells you instantly whether you are dealing with a positional sequence (IndexError) or a named dictionary (KeyError), which points at a different fix.
Finally, a quick pass with the debugger. Take the empty-list program above and change the call site to pause first:
scores = []
breakpoint()
print_average(scores)
When you run it, the program stops at a (Pdb) prompt before the failing call. Type p scores and Python prints [] — you have caught the empty list red-handed, without adding a single print you would later have to delete. Type c to continue (and watch it crash as expected), or q to quit. That is the whole loop in miniature: reproduce, read, isolate, hypothesize (“scores is empty”), test (p scores), fix.
Implications: security, privacy, performance, scalability, and cost
Security
Tracebacks are wonderful for you and dangerous when shown to strangers. A raw traceback can reveal file paths, function names, library versions, and fragments of internal logic — a map of your system that an attacker would love. The rule that follows is simple: detailed tracebacks belong in your development console and your private logs, never on a user’s screen or a public web page. Production web frameworks hide tracebacks from users by default for exactly this reason; when you build anything others touch, you show them a calm generic message and keep the real traceback where only you can read it.
Privacy
Error messages often quote the data that triggered them. A KeyError: 'ssn' or a ValueError printed with a customer’s raw input can spill personal information straight into a log file that is less protected than your database. As your programs start handling real data — including the training data and prompts of AI systems — treat what your errors print as seriously as what your program stores. Log the exception type and location freely; think twice before logging the offending value verbatim.
Performance
Reading errors well is itself a performance issue — of your time, the most expensive resource in any project. The difference between finding a bug in ten seconds and thirty minutes, multiplied across the dozens of errors in a working day, is the difference between finishing and floundering. There is also a small runtime dimension: raising and handling exceptions is not free, so exceptions are for exceptional situations, not for ordinary control flow you could express with a plain if. Use them to signal genuine problems, not as a routine branch taken thousands of times in a tight loop.
Scalability
As programs grow from one file to many, and from your laptop to a cluster, the traceback is what keeps failures findable. A stack that spans your code, a library, and a framework is exactly what lets you locate a bug in a hundred thousand lines you did not all write. This is also why logging — recording what happened to a durable stream, covered on Day 40 — scales where scattered print() calls do not: on a server running unattended, or across many machines, you cannot watch a console, so you capture exceptions to logs and read them after the fact. The bigger the system, the more its debuggability rests on well-captured errors.
Cost
Every hour spent stuck on a bug you could have read in a minute is real money, and in cloud and AI work the meter runs literally: a training job that crashes with an unread TypeError after two hours on rented GPUs has burned those hours for nothing. Fast, methodical debugging is one of the highest-leverage skills you can build precisely because it converts directly into saved time and saved spend. The habit you form this week pays out every day you write code.
Alternatives: free, open source, and commercial
The tools for reading errors and debugging range from what ships with Python to full graphical environments. Here is how the leading options compare and when to reach for each.
| Tool | Type | What it offers | Cost |
|---|---|---|---|
print() debugging | Built in | Zero setup; add a line, see a value. Best for a quick look. | Free |
pdb / breakpoint() | Built into Python | Pause any program, inspect variables, step line by line — no install. | Free |
Python logging module | Built into Python (Day 40) | Durable, level-controlled records for long-running and production code. | Free |
| VS Code debugger | Free commercial (open-source core) | A graphical debugger: click to set breakpoints, hover to see values, watch panes. | Free |
| PyCharm debugger | Commercial (free Community edition) | A powerful IDE debugger with rich inspection and conditional breakpoints. | Free tier; paid Pro |
For learning, master the free, built-in trio first: read the traceback, use print() for a quick check, and reach for breakpoint() when you need to pause and look around. Every one of these is free and always available, even on a bare server with no graphical interface. A graphical debugger in an editor like VS Code (free) or PyCharm (free Community edition; paid Professional edition adds features you will not need for a long while) makes the same pdb ideas friendlier — click a line to set a breakpoint, hover a variable to see its value — but it is a convenience layered on the fundamentals, not a replacement for understanding them. Learn the command-line debugger and every graphical one becomes obvious; learn only the graphical one and you are stuck the first time you meet a remote machine.
Comparison with related concepts
| Concept A | Concept B | Key difference |
|---|---|---|
| Exception | Traceback | An exception is the raised signal (“division by zero”); a traceback is the printed report of where it happened. |
| Syntax error | Runtime error | A syntax error stops the program from starting at all; a runtime error (like KeyError) happens while it runs. |
TypeError | ValueError | Wrong kind of value versus right kind but unacceptable value ("3" + 5 vs int("hello")). |
IndexError | KeyError | Missing position in an ordered sequence versus missing key in a dictionary. |
| Print-debugging | Interactive debugger | Prints require editing and re-running; the debugger pauses the live program so you can inspect anything. |
| Debugging | Testing | Debugging finds the cause of a known failure; testing (later in this course) tries to cause failures on purpose to catch them early. |
When to use it — and when not to
Reach for careful traceback-reading every single time a program raises an exception — which is to say, constantly. It is the fastest tool you have and the right first move for the overwhelming majority of failures: read the bottom line, read the bottom frame, and act. Reach for print-debugging when the traceback is not enough and you have a quick, specific question — “what is in this variable right here?” Reach for the interactive debugger when the situation is murkier: a wrong answer with no crash, a value you cannot explain, or a loop whose behavior you need to watch unfold. Reach for the full six-step method whenever a bug does not yield to a glance — reproduce, isolate, hypothesize, test — and reach for the rubber duck the moment you have been staring at the same lines for ten minutes without progress.
Know the limits too. Do not fire up the debugger for a bug the traceback already explains — that is slower, not faster. Do not scatter print() calls at random hoping one reveals something; a single well-placed, well-labelled print beats twenty guesses. Do not leave debugging prints in code you keep — remove them, and use the logging module for anything that must persist. And do not treat exceptions as ordinary control flow: if a missing key is a normal, expected case, check for it with if key in d or d.get(key) rather than catching a KeyError you provoked on purpose. The professional habit is to match the tool to the failure — read first, print for a quick check, debug for a real investigation — and to always, always fix the cause rather than silence the symptom.
Knowledge check
Try these from memory before looking back:
- In your own words, explain why you read a traceback from the bottom up. What does the very last line tell you, and what does the bottom-most
Fileframe tell you? - A program raises
ValueError: invalid literal for int() with base 10: 'hello'. What category of mistake is this, and how does it differ from aTypeError? - You look up
data["price"]and get aKeyError: 'price'. The lookup line is clearly correct. Where should you actually look for the bug, and why? - Name the six steps of the systematic debugging method in order, with one sentence on what each accomplishes.
- Give one situation where the interactive debugger (
breakpoint()) is clearly better than addingprint()calls, and one situation where aprint()is the better choice.
Hands-on exercise
Time to read real tracebacks and fix real bugs. In the Day 48 lab directory you will find three tiny Python programs, each of which crashes with a different common exception when you run it. Your job is to run each one, read its traceback the way you learned today, diagnose the cause, and fix it — recording your reasoning in a worksheet as you go.
First, run one of the buggy programs directly so you see a genuine traceback (from the lab directory):
python3 examples/buggy/average_scores.pyIt will crash. Read the output bottom-up: the last line names the exception type and message, and the bottom File frame names the line number and the exact line of code. Then run the guided walkthrough, which runs all three buggy programs, captures each traceback, and points out the exception type and culprit line for you:
bash examples/debug_walkthrough.shNow do the work yourself. The starter/ directory has its own copies of the three buggy programs. For each one, run it, fill in the matching row of starter/debug-worksheet.md (exception type, line number, cause, and your fix), then edit the program so it runs cleanly. Finally, run the test script to confirm the buggy versions still fail as expected and your fixed versions now succeed:
bash tests/run_tests.shExpected output
Running a buggy program prints a real traceback. For average_scores.py it looks like this (your Python version’s exact wording may differ slightly):
Traceback (most recent call last):
  File "examples/buggy/average_scores.py", line 5, in <module>
    print(f"Student {i + 1}: {scores[i]}")
                              ~~~~~~^^^
IndexError: list index out of range
Read bottom-up: IndexError: list index out of range is the what; line 5, print(f"Student {i + 1}: {scores[i]}"), is where it surfaced; and the caret marks scores[i] as the offending piece. The cause is a loop that counts one position too far. The guided walkthrough summarizes all three like this:
=== average_scores.py ===
Exception: IndexError: list index out of range
Culprit line 5: print(f"Student {i + 1}: {scores[i]}")

=== lookup_capital.py ===
Exception: KeyError: 'Germany'
Culprit line 6: print(f"The capital of {country} is {capitals[country]}.")

=== total_price.py ===
Exception: TypeError: can only concatenate str (not "int") to str
Culprit line 4: total = price + tax

All three buggy programs failed as expected. Now run the fixed versions:

--- fixed/average_scores.py ---
Student 1: 88
Student 2: 92
Student 3: 79
Student 4: 95
Average: 88.5

--- fixed/lookup_capital.py ---
The capital of Germany is unknown.

--- fixed/total_price.py ---
Total: 12
Validate your work
You are done when you can check every box:
- You ran each buggy program and saw its traceback with your own eyes.
- For each program you can state the exception type and the line number where it surfaced.
- Your
starter/debug-worksheet.mdhas all three rows filled in: type, line, cause, fix. - You edited each starter program so it runs without raising an exception.
-
bash tests/run_tests.shprints its success summary and exits 0.
Troubleshooting
python3: command not found. Usepythoninstead, or revisit Day 43 (installing Python). Confirm withpython3 --version.- “But my fixed program still crashes.” Read the new traceback — a fix can reveal a second bug, or introduce one. That is normal; run the loop again on the new error.
- The test script says a buggy program did not fail. You probably edited a file in
examples/buggy/by mistake; those must stay broken. Only edit the copies instarter/. Restore the originals withgit checkout -- examples/buggy. - You cannot tell which line the error is on. Look for the bottom-most
File "...", line N line in the traceback; N is the line, and the code shown beneath it is that line.
Common mistakes
- Reading the traceback top-down. The top frames are often inside libraries you did not write. Start at the bottom: the exception type, then the nearest frame.
- Fixing the symptom, not the cause. Wrapping a crash in a blanket
try/exceptthat hides it is not a fix; find why the value was wrong in the first place. - Editing the wrong copy. The
examples/buggy/programs are the reference and must stay broken so the walkthrough and tests work; do your fixing instarter/.
Practice assignment
Open starter/debug-worksheet.md and complete it fully for all three programs. For each one, record four things from your own investigation: the exact exception type and message, the line number where it surfaced, the underlying cause in one sentence (not just “it crashed” — why the value was wrong), and the specific change you made to fix it. Then, below the table, write one short paragraph (4–6 sentences) describing how the three bugs differ: what category of mistake each represents (a bad index, a missing key, a type mismatch), and how the exception type alone told you which kind of fix each needed. Keep the worksheet — recognizing exception types on sight is a skill that compounds, and a later lesson builds on it.
Extension challenge
Go one level deeper and practice the interactive debugger on a real pause. Take a copy of starter/average_scores.py (before you fix it, or a fresh broken copy) and add the line breakpoint() immediately before the for loop. Run it with python3, and when you reach the (Pdb) prompt, use the debugger to investigate: type p scores to print the list, p len(scores) to see its length, and n a few times to step through the loop one iteration at a time, printing p i and p scores[i] at each step until you watch the exact moment i walks off the end. Write two or three sentences describing what you saw at the last valid index versus the first invalid one, and explain why stepping through in the debugger showed you the bug more directly than the crash alone did. You have just done what professional engineers do when a value refuses to make sense — paused the living program and asked it, one line at a time, what it was really doing.
Quiz
Q1. In which order should you read a Python traceback, and why?
- Top to bottom, because the first frame is always where your bug is
- Bottom to top, because the last line names the exception and the frame above it shows where the error surfaced
- It does not matter; every line says the same thing
- Only the middle frames matter; ignore the top and bottom
Show answer
Answer: B. Bottom to top, because the last line names the exception and the frame above it shows where the error surfaced
Tracebacks list calls oldest-first, so the most recent call sits at the bottom next to the exception. Reading bottom-up gives you the "what" (the exception type and message) and then the "where" (the nearest frame) with the least wasted effort.
Q2. A program raises TypeError. What category of mistake does that signal?
- A dictionary key that does not exist
- A sequence index that is out of range
- An operation given a value of the wrong type, such as adding a string to a number
- Code that Python could not parse at all
Show answer
Answer: C. An operation given a value of the wrong type, such as adding a string to a number
A TypeError means an operation received the wrong KIND of value — for example "3" + 5, where no value would make string-plus-integer valid. That differs from a ValueError, where the type is right but the specific value is unacceptable.
Q3. What is the difference between a TypeError and a ValueError?
- A TypeError is the wrong kind of value; a ValueError is the right kind of value but an unacceptable one
- They are two names for exactly the same error
- A ValueError only happens with dictionaries; a TypeError only happens with lists
- A TypeError happens before the program starts; a ValueError happens while it runs
Show answer
Answer: A. A TypeError is the wrong kind of value; a ValueError is the right kind of value but an unacceptable one
int("hello") raises ValueError because a string is the right type for int() but "hello" is not a number. "3" + 5 raises TypeError because a string and an integer are incompatible kinds for the + operation.
Q4. You look up my_list[5] on a list that has three items. Which exception is raised?
- KeyError
- IndexError
- ValueError
- AttributeError
Show answer
Answer: B. IndexError
IndexError means a sequence index is out of range. A three-item list has valid positions 0, 1, and 2, so asking for position 5 walks off the end. A missing lookup in a dictionary would instead raise KeyError.
Q5. What is the correct order of the six-step systematic debugging method?
- Fix, read, reproduce, test, isolate, hypothesize
- Reproduce, read, isolate, hypothesize, test, fix
- Hypothesize, fix, read, reproduce, isolate, test
- Read, fix, reproduce, hypothesize, isolate, test
Show answer
Answer: B. Reproduce, read, isolate, hypothesize, test, fix
First make the failure reproducible, then read the error, isolate the smallest failing piece, form one testable hypothesis about the cause, test it, and only then fix the cause — re-running your reproduction to confirm.
Q6. What does the built-in breakpoint() function do when your program reaches it?
- It permanently deletes the current variable to free memory
- It pauses the running program and drops you into the interactive debugger so you can inspect variables and step line by line
- It prints every variable in the program and then exits
- It restarts the program from the first line
Show answer
Answer: B. It pauses the running program and drops you into the interactive debugger so you can inspect variables and step line by line
breakpoint() (added in Python 3.7) stops execution at that line and opens the pdb debugger prompt, where commands like p (print a value), n (next line), s (step into), and c (continue) let you inspect the live program without adding and re-running print statements.
Q7. Why is it said that "where the program broke is not always where it went wrong"?
- Because Python reports line numbers at random
- Because the error surfaces at the line that failed, but the real cause can be earlier code or a calling function that supplied a bad value
- Because tracebacks never include the correct file name
- Because every exception is actually a SyntaxError in disguise
Show answer
Answer: B. Because the error surfaces at the line that failed, but the real cause can be earlier code or a calling function that supplied a bad value
A ZeroDivisionError on total / len(values) is genuine, but the actual mistake may be far earlier where values was filled from an empty file. The call stack exists precisely so you can climb from the symptom to a cause hiding in a caller.
Q8. Why should you avoid showing raw tracebacks to the users of a program you build?
- Tracebacks make the program run more slowly for users
- Tracebacks can leak file paths, versions, internal logic, and sometimes user data, which is a security and privacy risk
- Users are legally forbidden from reading tracebacks
- Tracebacks only display correctly for the original author
Show answer
Answer: B. Tracebacks can leak file paths, versions, internal logic, and sometimes user data, which is a security and privacy risk
A raw traceback can reveal file paths, function names, library versions, and even the offending data — a useful map for an attacker. Detailed tracebacks belong in your private console and logs; users should see a calm generic message instead.
Glossary
- exception
- A signal Python raises when it cannot carry out an instruction; it has a type that categorizes the problem and usually a message with the specifics, and it stops normal execution unless the program catches it.
- traceback
- The report Python prints when an uncaught exception occurs, showing the chain of function calls that led to the failure, each with its file, line number, and code, ending with the exception type and message.
- stack frame
- One entry in a traceback (and in the call stack): a single function's place in the chain of calls, recording the file, line number, function name, and the exact line being executed.
- call stack
- The ordered chain of function calls active at a given moment — who called whom — which the traceback lists oldest-first so the most recent call sits nearest the error.
- SyntaxError
- An error raised when Python cannot parse your code because it is not valid Python; it stops the program from starting at all.
- IndentationError
- A special kind of SyntaxError caused by wrong or inconsistent indentation, such as a line indented where Python did not expect it.
- NameError
- An error raised when you use a name that does not exist, usually because of a typo or because the name was used before it was defined.
- TypeError
- An error raised when an operation receives a value of the wrong type, such as trying to add a string to an integer.
- ValueError
- An error raised when a value is the right type but unacceptable for the operation, such as calling int("hello").
- IndexError
- An error raised when you access a position in an ordered sequence (a list or tuple) that is out of range.
- KeyError
- An error raised when you look up a key in a dictionary that does not exist.
- AttributeError
- An error raised when you access an attribute or method that an object does not have, often due to a typo in the method name.
- ModuleNotFoundError
- An error raised when Python cannot find a module you tried to import, commonly because it is not installed in the current environment.
- pdb
- Python's built-in interactive debugger, which lets you pause a running program at a prompt and inspect variables, step line by line, and continue.
- breakpoint
- A built-in function (added in Python 3.7) that pauses the program where it is called and drops you into the pdb debugger, replacing the older import pdb; pdb.set_trace() incantation.
- print-debugging
- The practice of adding temporary print() calls to reveal a program's values and control flow; fast for a quick, specific question but requires editing and re-running.
- rubber-duck debugging
- The practice of explaining your code aloud, line by line, to an inanimate object or patient listener, which often surfaces the flaw the moment intent and reality are compared.
Sources and further reading
- Errors and Exceptions — Python Software Foundation (accessed 2026-07-12)
- Built-in Exceptions — Python Software Foundation (accessed 2026-07-12)
- pdb — The Python Debugger — Python Software Foundation (accessed 2026-07-12)
- Python Traceback — Real Python (accessed 2026-07-12)
- The Missing Semester of Your CS Education — Debugging and Profiling — MIT (accessed 2026-07-12)
Kept in this browser, no account needed. Your progress page turns the whole record into one link you can bookmark or open on another device.