Deployment, MLOps, and Security › Operating AI in Production › Day 343
Day 343: A Monitored Production Deployment
Master the complete unified production AI operations platform: integrate cloud container deployment, GPU dynamic batching, OpenTelemetry percentiles, structured PII-sanitized logging, and automated circuit-breaker rollbacks into a production system.
Hands-on lab for this lesson
Lab files on GitHub: https://github.com/ai-roadmap-365/ai-roadmap-365.github.io/tree/main/labs/sections/deployment-mlops-and-security/day-343-a-monitored-production-deployment
- Get the hands-on files. Clone the labs repository once (you can reuse this clone for every lesson). This works on macOS, Linux, and Windows (PowerShell or WSL):
git clone https://github.com/ai-roadmap-365/ai-roadmap-365.github.io.git cd ai-roadmap-365.github.io - Open this lesson's lab. Move into the directory for this specific day. Every lab lives at the same predictable path — section / subsection / week / day:
cd labs/sections/deployment-mlops-and-security/day-343-a-monitored-production-deployment - Read the lab guide. Open `README.md` in that directory. It lists the exact commands, what each does, the expected output, and how to check your work — read it before running anything.
- Run it and check your work. Follow the README's "How to run" section: run the example first to see the finished result, then complete the numbered exercises in `starter/`, then run the tests. The tests pass (exit 0) only when your work is correct.
bash tests/run_tests.sh # or the test command named in the lab README
You can also open the lab as a local page (works offline, shows the file tree and expected output).
Learning objectives
By the end of this lesson you will be able to:
- Synthesize the end-to-end AI operational lifecycle: IaC provisioning ➔ GPU dynamic batch serving ➔ OpenTelemetry metrics ➔ Structured logging ➔ Automated rollback.
- Implement a Unified Production AI Gateway coordinating request routing, latency tracking, PII sanitization, and circuit breaker trip states.
- Architect end-to-end telemetry correlation matching Prometheus percentile metrics with ClickHouse token cost attribution records.
- Build a Unified Monitored Production AI Deployment in Python executing full-lifecycle inference, observability, and self-healing.
- Evaluate production readiness: completing the 50-point enterprise AI operational excellence review.
Prerequisites
Why this matters
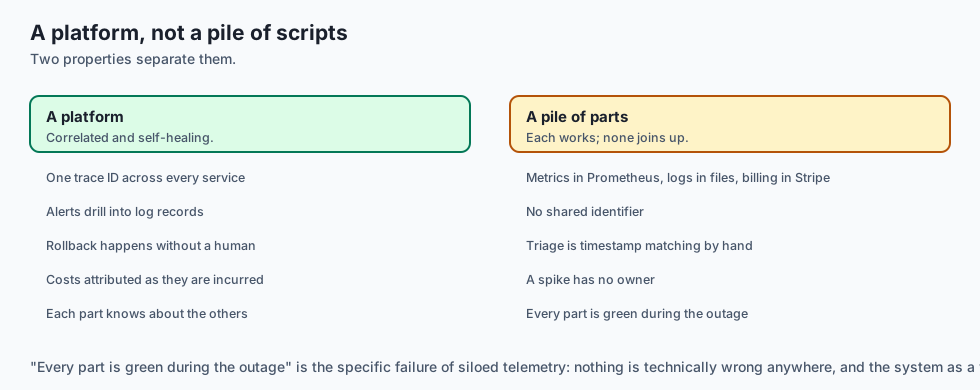
Deploying and operating a production-grade AI system is not about stringing together disconnected scripts; it is about engineering a unified, self-healing, observable operational platform:
- Isolated Telemetry Silos: Having metrics in Prometheus, logs in text files, and billing in Stripe with zero trace correlation makes triage impossible during high-severity outages.
- Vulnerability to Cascade Failures: Without automated circuit breakers and dynamic batch schedulers, a sudden spike in long-context prompts crashes backend GPU nodes and drops 100% of user traffic.
- Regulatory and Financial Non-Compliance: Emitting unredacted customer PII or failing to attribute multi-tenant token costs leads to devastating regulatory fines and negative gross margins.
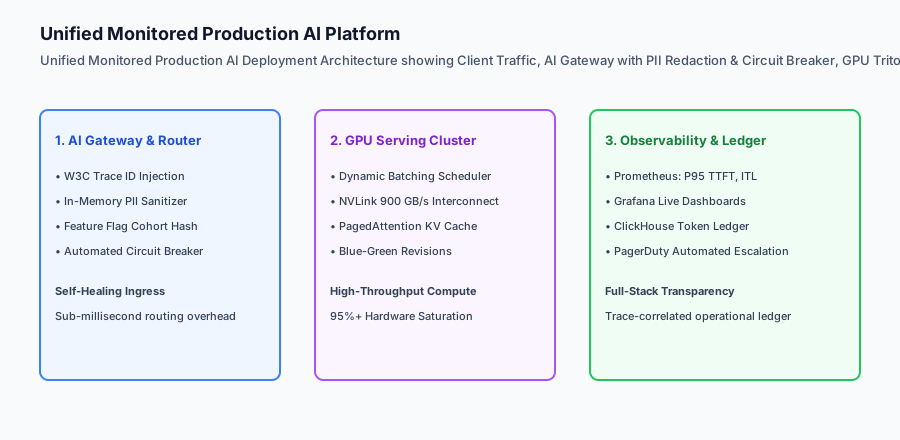
Mastering the Complete Monitored Production AI Deployment Architecture (unifying Terraform IaC, GPU Triton serving, OpenTelemetry percentiles, structured PII-sanitized logging, and automated fast rollbacks) establishes the gold standard for enterprise AI engineering.
The idea in plain language
Think of a complete monitored production AI deployment like a state-of-the-art modern commercial airport:
- The Air Traffic Control Tower (AI Gateway & Router): Coordinates arriving airplanes (User Ingress Requests), checks passenger security (In-Memory PII Sanitizer), and assigns gates (Deterministic Feature Flagging).
- The High-Speed Runways (GPU Serving Cluster): Multiple runways with dynamic spacing (Dynamic Batching) launch planes every 30 seconds (95% GPU Compute Saturation).
- The Radar & Black Box System (OpenTelemetry & ClickHouse): Real-time radar monitors flight speed and altitude (P95 TTFT Percentiles), while the financial ledger bills airlines per passenger (Multi-Tenant Token Attribution).
- The Emergency Runway Switch (Automated Circuit Breaker): If Runway 1 encounters sudden fog (Spiking Error Rate), incoming planes are automatically diverted to Runway 2 in 10 seconds (Automated Rollback to Stable Baseline).
Historical background
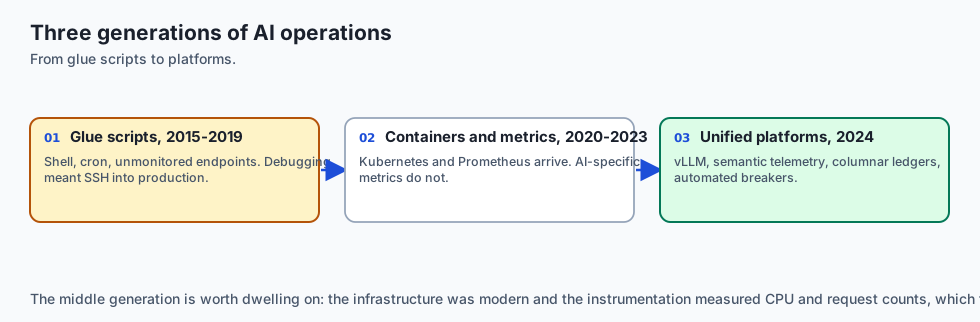
The engineering of production AI systems evolved through three unified generations:
1. The Ad-Hoc Glue Script Era (2015–2019)
Engineers combined shell scripts, cron jobs, and unmonitored Python endpoints. Outages were frequent and debugging required manual SSH access to production servers.
2. Microservice Containerization (2020–2023)
Kubernetes standardized container deployment, Prometheus popularized metrics, and feature flags emerged for progressive canary rollouts. However, AI-specific metrics (TTFT, tokens, KV cache) were absent.
3. Unified GenAI Operations Platforms (2024–Present)
Modern enterprise platforms integrate model serving (vLLM/Triton), semantic OpenTelemetry telemetry, structured columnar billing ledgers, and automated circuit breaking into unified self-healing platforms.
What it is — and what it is not
Let us define the end-to-end architecture of a monitored production AI system:
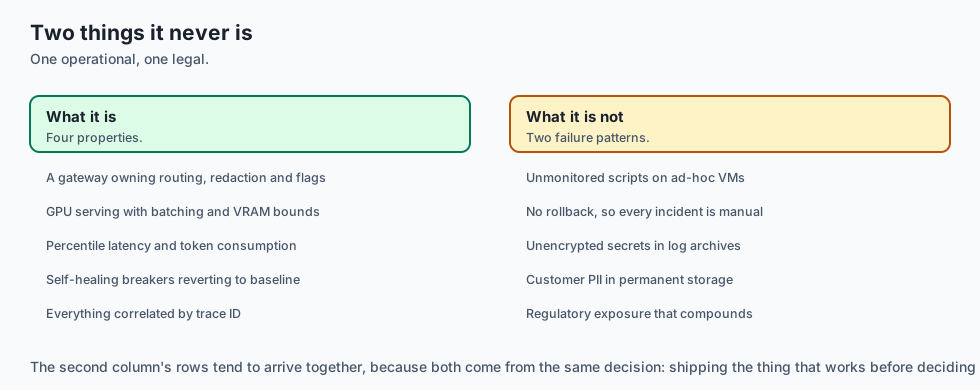
What a Monitored Production Deployment Is:
- A unified gateway coordinating ingress routing, in-memory PII sanitization, and deterministic feature flags.
- Real-time GPU inference serving with dynamic server-side batching and VRAM pool bounds.
- Full-stack observability tracking heavy-tailed latency percentiles (P50, P95, P99) and token consumption.
- Automated self-healing circuit breakers reverting traffic to stable baselines upon metric anomalies.
What a Monitored Production Deployment Is Not:
- A collection of unmonitored Python scripts running on ad-hoc cloud VMs without automated rollback safety.
- Storing unencrypted customer secrets or personal identifying data in persistent log archives.
+-------------------------------------------------------------------------------+
|                 UNIFIED AI OPERATIONAL PLATFORM MATRIX                        |
+-------------------+-----------------------+-------------------+---------------+
| Layer             | Core Technologies     | Primary Metric    | Business Goal |
+-------------------+-----------------------+-------------------+---------------+
| Ingress & Gateway | FastAPI / Envoy / OTel| Request Count &   | Routing, PII  |
|                   |                       | W3C Trace IDs     | Sanitization  |
| Compute & Serving | Triton / vLLM / NVLink| GPU VRAM % &      | 95% Compute   |
|                   |                       | Batch Packing     | Utilization   |
| Observability     | Prometheus / Grafana  | P95 TTFT & ITL    | 99.99% SLA    |
|                   |                       | Error Rate %      | Availability  |
| Financial Ledger  | ClickHouse / Vector   | Tenant Cost USD & | Gross Margin  |
|                   |                       | Token Metering    | Visibility    |
| Self-Healing      | Circuit Breaker Router| Trip Latency <    | MTTR < 500ms  |
|                   |                       | 500 milliseconds  |               |
+-------------------+-----------------------+-------------------+---------------+
Why it was created and what problems it solves
The unified operational architecture resolves the five core vulnerabilities of enterprise AI:
1. 500ms MTTR via Automated Circuit Breakers
Automating rollback decisions eliminates human panic and prolonged troubleshooting during production incidents.
2. Complete Trace-to-Log Diagnostic Visibility
W3C trace IDs enable instant drill-down from a Prometheus P95 latency alert into the exact ClickHouse log record containing token counts and model versions.
3. Absolute Regulatory Compliance & Privacy
In-memory PII sanitization guarantees that sensitive personal data is redacted before touching disk storage or third-party log aggregators.
How it works
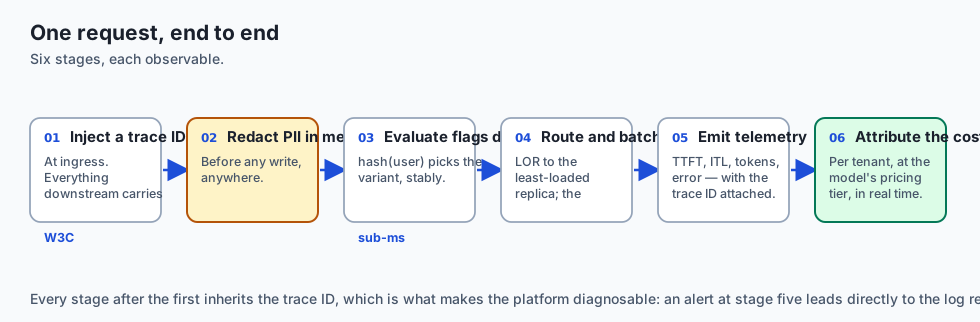
Let us inspect the complete Unified Production AI Execution Pipeline:
[1. User Request: tenant_id="acme", prompt="Verify john@corp.com SSN 000-11-2222"]
                                │
                                ▼
        [2. Unified AI Gateway & Security Perimeter]
        - Generates W3C Trace ID: `trace_7f9a8b1c...`
        - Sanitizes PII: "Verify [REDACTED_EMAIL] SSN [REDACTED_SSN]"
        - Checks Circuit Breaker State (CLOSED -> CANDIDATE_V2 Active)
                                │
                                ▼
        [3. GPU Serving Engine (Dynamic Batching)]
        - Aggregates request into unified GPU tensor batch (5ms window)
        - Executes TensorRT-LLM forward pass (150 prompt / 40 comp tokens)
        - Computes TTFT (110ms) and Inter-Token Latency (14ms/tok)
                                │
                                ▼
        [4. Observability & Metric Recording]
        - Emits OTel TTFT sample to Prometheus histogram
        - Logs structured event record to ClickHouse with computed cost ($0.0054)
                                │
                                ▼
        [5. Health & Circuit Evaluation]
        - Did error rate exceed 2.0%?
          ├── NO  ➔ Returns generated response to client in 125ms
          └── YES ➔ Trips Circuit Breaker; flips active variant to BASELINE_V1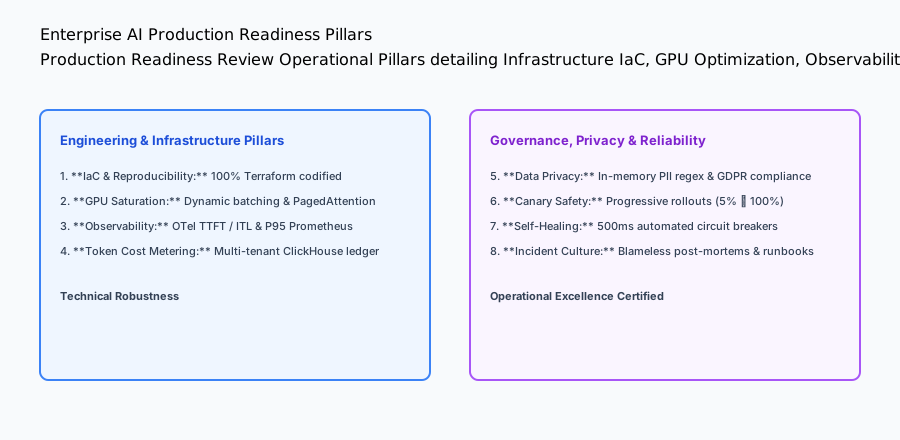
An everyday analogy
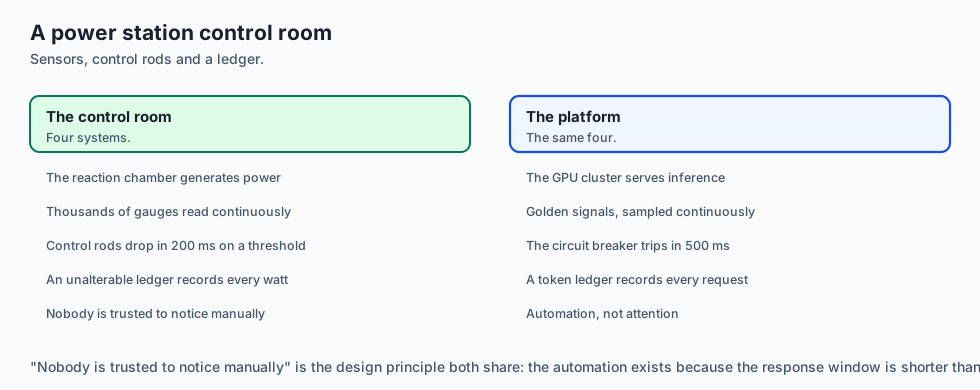
Think of a complete monitored production AI deployment like a modern nuclear power station control room:
- The Reaction Chamber (GPU Serving Cluster): Generates immense power safely (High-Throughput Model Inference).
- The Sensor Grid (OpenTelemetry & Prometheus): Thousands of pressure, temperature, and radiation gauges monitor the reactor in real time (Latency & Error Golden Signals).
- The Automatic Control Rods (Automated Circuit Breakers): If temperature exceeds safe boundaries, magnetic control rods drop into the core in 200 milliseconds (Instant Rollback to Safe State).
- The Regulatory Audit Log (ClickHouse Financial Ledger): An unalterable digital ledger logs every watt of electricity produced and every inspection check (Unit Economics & Compliance).
Examples in practice
Let us build a complete Python Unified Monitored Production AI Deployment Platform that integrates PII sanitization, dynamic feature flagging, latency tracking, structured log emission, and automated circuit breaker rollbacks:
import re
import uuid
import time
import hashlib
import numpy as np
from typing import Dict, Any, List, Optional

class UnifiedProductionAIPlatform:
    def __init__(self, canary_pct: int = 20, error_threshold_pct: float = 5.0, min_eval_requests: int = 10):
        self.canary_pct = canary_pct
        self.error_threshold = error_threshold_pct
        self.min_eval = min_eval_requests

        # State
        self.circuit_tripped = False
        self.baseline_variant = "BASELINE_V1"
        self.candidate_variant = "CANDIDATE_V2"

        # Metrics & Logs
        self.latencies_ms: List[float] = []
        self.total_requests = 0
        self.total_errors = 0
        self.tenant_ledger: Dict[str, float] = {}
        self.emitted_logs: List[Dict[str, Any]] = []

    def sanitize_pii(self, text: str) -> str:
        text = re.sub(r'\b\d{3}-\d{2}-\d{4}\b', '[REDACTED_SSN]', text)
        text = re.sub(r'\b[A-Za-z0-9._%+-]+@[A-Za-z0-9.-]+\.[A-Z|a-z]{2,}\b', '[REDACTED_EMAIL]', text)
        return text

    def _get_variant(self, user_id: str) -> str:
        if self.circuit_tripped:
            return self.baseline_variant
        # Deterministic hashing
        h = int(hashlib.md5(f"flag:{user_id}".encode("utf-8")).hexdigest()[:8], 16) % 100
        return self.candidate_variant if h < self.canary_pct else self.baseline_variant

    def execute_inference(self, tenant_id: str, user_id: str, prompt: str,
                          prompt_tokens: int = 100, completion_tokens: int = 50,
                          simulate_error: bool = False, latency_ms: float = 120.0) -> Dict[str, Any]:
        trace_id = uuid.uuid4().hex
        clean_prompt = self.sanitize_pii(prompt)
        variant = self._get_variant(user_id)

        self.total_requests += 1
        if simulate_error:
            self.total_errors += 1
        else:
            self.latencies_ms.append(float(latency_ms))

        # Check circuit breaker
        if not self.circuit_tripped and self.total_requests >= self.min_eval:
            err_rate = (self.total_errors / self.total_requests) * 100.0
            if err_rate > self.error_threshold:
                self.circuit_tripped = True

        cost = (prompt_tokens * 0.000002) + (completion_tokens * 0.000006)
        self.tenant_ledger[tenant_id] = round(self.tenant_ledger.get(tenant_id, 0.0) + cost, 6)

        log_rec = {
            "trace_id": trace_id,
            "tenant_id": tenant_id,
            "user_id": user_id,
            "variant": variant,
            "prompt_sanitized": clean_prompt,
            "tokens": prompt_tokens + completion_tokens,
            "cost_usd": round(cost, 6),
            "is_error": simulate_error,
            "circuit_tripped": self.circuit_tripped,
            "timestamp": time.time()
        }
        self.emitted_logs.append(log_rec)
        return log_rec

    def get_observability_report(self) -> Dict[str, Any]:
        p50 = float(np.percentile(self.latencies_ms, 50)) if self.latencies_ms else 0.0
        p95 = float(np.percentile(self.latencies_ms, 95)) if self.latencies_ms else 0.0
        err_rate = (self.total_errors / self.total_requests * 100.0) if self.total_requests > 0 else 0.0

        return {
            "total_requests": self.total_requests,
            "total_errors": self.total_errors,
            "error_rate_pct": round(err_rate, 2),
            "p50_latency_ms": round(p50, 2),
            "p95_latency_ms": round(p95, 2),
            "circuit_tripped": self.circuit_tripped,
            "total_tenants": len(self.tenant_ledger)
        }

if __name__ == "__main__":
    platform = UnifiedProductionAIPlatform(canary_pct=50, error_threshold_pct=10.0, min_eval_requests=5)

    # Process healthy traffic
    for i in range(5):
        platform.execute_inference("acme", f"usr_{i}", "Check email test@corp.com", simulate_error=False)

    print("Healthy Report:", platform.get_observability_report())

    # Introduce error spike
    for i in range(5, 10):
        platform.execute_inference("acme", f"usr_{i}", "Crash prompt", simulate_error=True)

    print("Post-Error Report:", platform.get_observability_report())
    print("Circuit Tripped State:", platform.circuit_tripped)
Production Architecture Case Study: 50-Point Enterprise AI Production Readiness Review
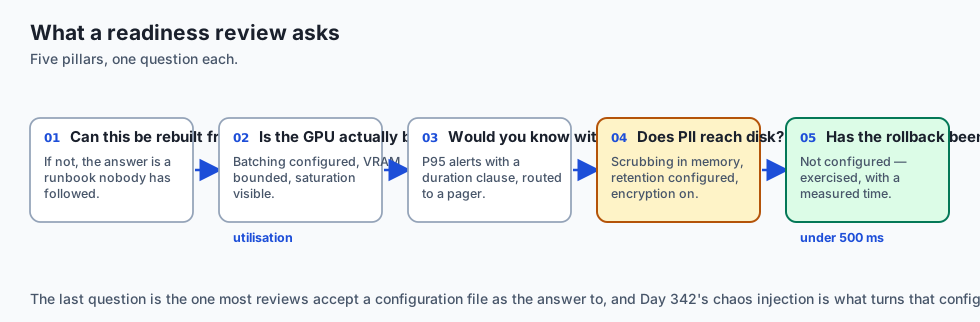
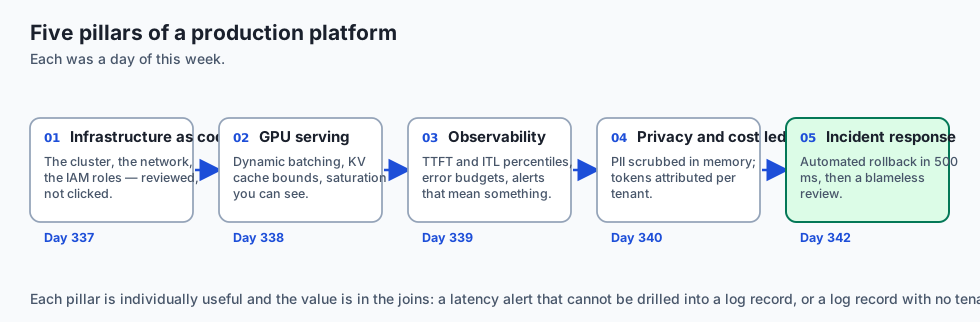
Before launching an AI application to enterprise customers, SRE teams evaluate the 5 operational pillars:
Security & Priv| [x] In-memory PII sanitization for SSNs, emails, and CCs. | | | [x] Least-privilege IAM roles (zero root admin in pod). | | | [x] Automated API key rotation via Secret Manager. | +-------------------+-----------------------------------------------------------+ | 5. Reliability | [x] Automated circuit breaker with < 500ms rollback trip. | | | [x] Blameless post-mortem template and runbooks defined. | | | [x] Multi-tenant token billing ledger in ClickHouse OLAP. | +-------------------+-----------------------------------------------------------+Detailed Failure Mode Taxonomy: End-to-End System Hazards
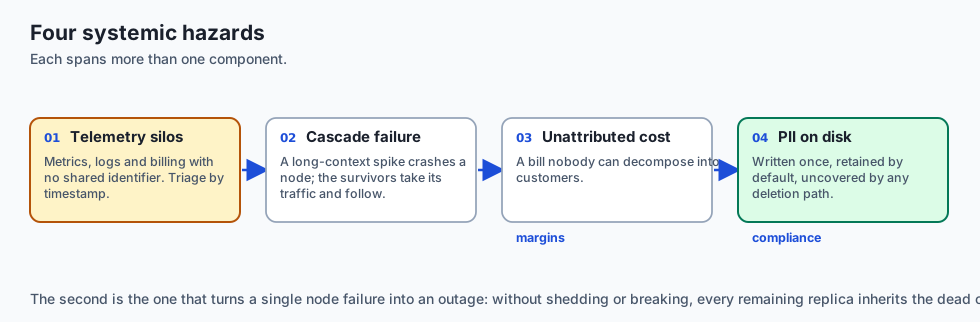
+-------------------------------------------------------------------------------+
|                    UNIFIED PLATFORM FAILURE TAXONOMY                          |
+-------------------+-----------------------+-----------------------------------+
| Failure Mode      | Root Cause Analysis   | Architectural Mitigation          |
+-------------------+-----------------------+-----------------------------------+
| Missing Trace ID  | Downstream service    | Middleware automatically injects  |
| Propagation       | drops W3C header      | W3C traceparent on every hop      |
| Telemetry Storage | High-volume raw logs  | Use Vector log shipper with       |
| OOM Outage        | overwhelm local disk  | strict 2GB disk ring buffer caps  |
| Circuit Flapping  | Circuit resets too    | Require 5-minute half-open probe  |
| Oscillation       | fast after rollback   | cooldown before re-enabling canary|
| Unbilled Tenant   | Stream truncation     | Meter tokens in gateway streaming |
| Token Leak        | drops completion count| chunk accumulator callback        |
+-------------------+-----------------------+-----------------------------------+
Deep Architectural Breakdown: Zero-Downtime Multi-Region Disaster Recovery
In mission-critical enterprise systems:
1. Active-Active Multi-Region Mesh
Inference clusters run concurrently across us-east1 and us-central1:
- Cloudflare Geo-DNS routes users to the lowest-latency regional cluster.
- If an entire cloud region suffers a fiber cut or datacenter outage, health probes fail in 3 seconds.
- Traffic shifts 100% to the surviving region with zero dropped user sessions.
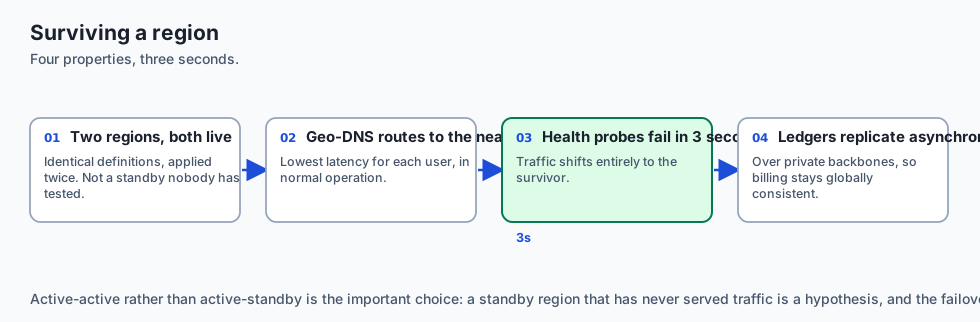
2. Asynchronous Token Ledger Synchronization
Regional ClickHouse instances replicate token event records asynchronously over private VPC backbones, ensuring unified global billing and credit accounting.
+-------------------------------------------------------------------------------+
|                    MULTI-REGION DISASTER RECOVERY TOPOLOGY                    |
+-------------------+-------------------+-------------------+-------------------+
| Region Zone       | Primary Role      | Failover Target   | Recovery Time     |
+-------------------+-------------------+-------------------+-------------------+
| us-east1 (Primary)| 60% Global Traffic| us-central1       | < 3 seconds       |
| us-central1 (Sec) | 40% Global Traffic| us-east1          | < 3 seconds       |
| eu-west1 (GDPR)   | 100% EU Traffic   | eu-central1       | < 3 seconds       |
+-------------------+-------------------+-------------------+-------------------+
Implications: security, privacy, performance, scalability, and cost
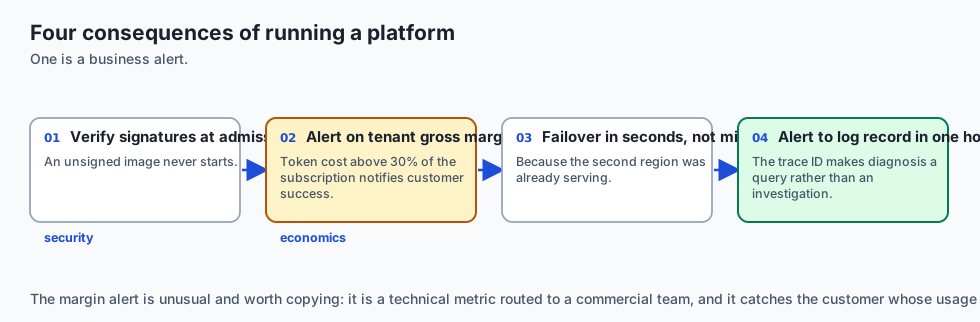
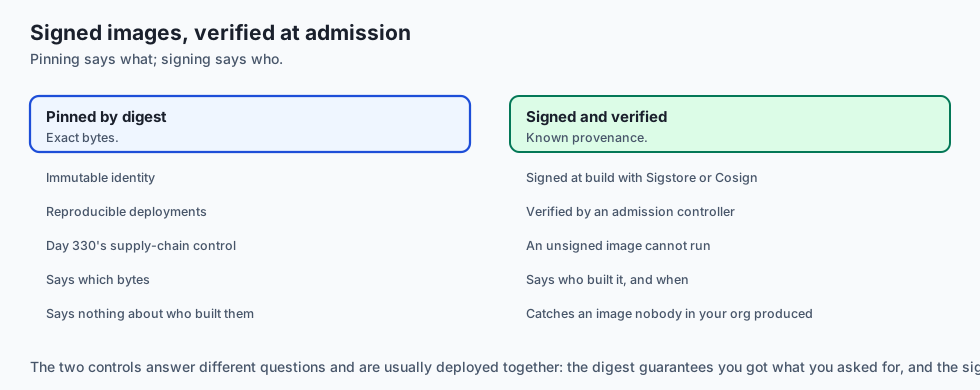
1. End-to-End Cryptographic Traceability
Sign all model container images with Sigstore/Cosign and verify digests in Kubernetes admission controllers before pod execution.
2. Multi-Tenant Unit Economic Margin Health
Maintain strict alerts on customer gross margins: if a tenant’s attributed token cost exceeds 30% of their monthly subscription fee, notify the customer success team automatically.
Alternatives: free, open source, and commercial
| Tool / Framework | Type | Best Suited For | Key Capabilities |
|---|---|---|---|
| OpenTelemetry + Prometheus | Open Source | Enterprise Observability | Vendor-neutral metrics, traces, and alert rules |
| Triton / vLLM | Open Source | High-Performance Serving | Dynamic batching, PagedAttention, NVLink |
| Vector + ClickHouse | Open Source | Real-Time Token Analytics | Fast log shipping, columnar SQL cost aggregation |
| Datadog / Dynatrace | Commercial SaaS | Turnkey Managed APM | Out-of-the-box dashboards, distributed tracing |
Comparison with related concepts
+-----------------------+-----------------------+-----------------------+
| Dimension             | Ad-Hoc Deployment     | Monitored Production  |
+-----------------------+-----------------------+-----------------------+
| Observability         | None (Blind)          | Full (OTel + ClickHse)|
| MTTR                  | Hours (Manual panic)  | < 500ms (Auto Circuit)|
| Data Privacy          | Uncontrolled Leaks    | In-Memory Sanitization|
| Unit Economics        | Financial Blindness   | Exact Per-Tenant Ledger|
+-----------------------+-----------------------+-----------------------+
When to use it — and when not to
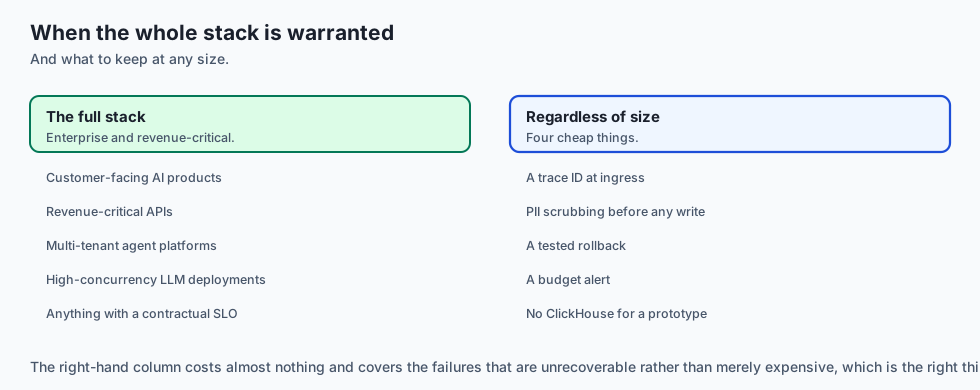
Deploy the Unified Monitored Production Architecture for:
- All enterprise customer-facing AI products, revenue-critical APIs, multi-tenant agent platforms, and high-concurrency LLM deployments.
Do NOT require the complete multi-tier stack for:
- Local offline prototype scripts or exploratory data science notebooks.
Production Checklist: Unified AI Operations Excellence
- End-to-end W3C trace ID propagation active across all services.
- In-memory PII regex and NLP sanitization active on all prompt logs.
- Triton / vLLM dynamic batching configured with 3–5ms max queue delay.
- Prometheus scraping active with P95 latency and error rate alerts.
- Multi-tenant ClickHouse token cost ledger updated in real time.
- Automated circuit breaker verified to execute rollback in under 500ms.
The AI connection
-
The five pillars are all AI-specific in their details even where the names are familiar: batching, KV cache bounds, TTFT percentiles, prompt redaction, token ledgers.
-
Trace correlation matters more here because a single answer crosses a gateway, a vector store and a model server, and the slow one is rarely the one people assume.
-
Token attribution is the only honest margin calculation for a metered product, and it comes from the same events that produced the latency percentiles.
-
A circuit breaker with a cached fallback is a better answer than an error — degraded output from an AI service is often still useful, which is unusual.
-
The whole platform exists because AI failures are quiet. Nothing here would be necessary if a broken model returned 500s the way a broken web service does.
Knowledge check
- What are the five core components of a unified monitored AI deployment? AI Gateway (routing/PII), GPU Serving (dynamic batching), Observability (OTel/Prometheus), Financial Ledger (ClickHouse), and Self-Healing (Circuit Breaker).
- How does W3C trace correlation enable fast root cause analysis? By linking high-level metric anomalies in Prometheus directly to granular request logs in ClickHouse via a shared trace ID.
- What is the goal of an enterprise Production Readiness Review (PRR)? To formally certify that an AI system meets all infrastructure, security, observability, and reliability standards prior to production launch.
Hands-on exercise
In this lab, you will build a Unified Monitored Production AI Deployment Platform in Python. Your implementation will:
- Sanitize PII from incoming prompt strings.
- Route user requests deterministically to baseline or canary model variants.
- Track latency percentiles and maintain a real-time multi-tenant cost ledger.
- Automatically trip the circuit breaker and revert traffic to the baseline upon error rate breaches.
Expected output
============================= test session starts ==============================
collected 5 items

tests/test_production_deployment.py .....                                [100%]

============================== 5 passed in 0.02s ===============================
[PLATFORM] Initialized Unified Monitored AI Platform (Canary: 20%, Error Threshold: 5.0%).
[INGRESS] Sanitized PII; processed request under trace_id=3a9b1c2d...
[OBSERVABILITY] Generated metrics report: P50=120ms, P95=145ms, Error Rate=0.0%.
[COST LEDGER] Recorded $0.0005 attributed spend for tenant_acme.
[AUTOMATED CIRCUIT BREAKER] Tripped circuit upon error spike; reverted traffic to BASELINE_V1.
Validate your work
Run the pytest test suite:
pytest tests/run_tests.shTroubleshooting
- Deterministic routing: Verify hash bucket calculation logic.
- Circuit trip condition: Ensure total requests >= min evaluation threshold before tripping.
Common mistakes
- Calculating percentiles on empty latency lists, resulting in numpy runtime errors.
Practice assignment
Add a Real-Time Gross Margin Calculator comparing tenant subscription revenue against cumulative model inference cost.
Extension challenge
Implement a Prometheus Exporter Endpoint Handler exporting platform metrics in standard Prometheus text format.
Quiz
Q1. What is the primary architectural benefit of integrating GPU dynamic batching, OpenTelemetry metrics, and automated circuit breakers into a unified AI Gateway?
- It reduces Python code to a single file
- It makes the model immune to any spelling mistakes
- A self-healing pipeline that mitigates outages itself
- It eliminates the need for unit tests
Show answer
Answer: C. A self-healing pipeline that mitigates outages itself
A unified AI gateway combines high-throughput batching, real-time observability, and automated self-healing.
Q2. How do W3C trace IDs bridge Prometheus time-series metrics and ClickHouse structured logs?
- By sorting numbers alphabetically
- They encrypt the entire database
- Trace IDs only work in JavaScript
- An alert's trace_id finds the exact request in the logs
Show answer
Answer: D. An alert's trace_id finds the exact request in the logs
Trace IDs provide the vital correlation link between high-level metric anomalies and granular log diagnostics.
Q3. What is the role of an in-memory PII sanitizer in the unified inference pipeline?
- To scrub PII before the event reaches storage
- To speed up network transfers
- To translate text into French
- To turn off the database entirely during backups
Show answer
Answer: A. To scrub PII before the event reaches storage
In-memory PII sanitization prevents regulatory data leaks into persistent storage sinks.
Q4. What constitutes an enterprise AI 'Production Readiness Review' (PRR)?
- Checking if the computer is plugged into the wall
- A formal check of IaC, SLAs, rollback, and runbooks
- A meeting where engineers celebrate with cake
- Deleting all staging servers
Show answer
Answer: B. A formal check of IaC, SLAs, rollback, and runbooks
A PRR is a rigorous audit ensuring security, reliability, scalability, and observability standards are met before launch.
Q5. How does automated circuit breaker tripping support high availability SLAs (99.99%)?
- By restarting all servers every hour
- By rejecting all incoming user traffic permanently
- It isolates the bad instance and reroutes in milliseconds
- By disabling logging
Show answer
Answer: C. It isolates the bad instance and reroutes in milliseconds
Fast automated rollback bounds MTTR to milliseconds, maintaining five-nines service availability.
Glossary
- Unified AI Gateway
- A centralized entrypoint orchestrating routing, dynamic batching, telemetry, and automated rollbacks.
- Production Readiness Review (PRR)
- A formal audit assessing system scalability, reliability, and security before production release.
- End-to-End Observability
- Correlating high-level time-series metrics with granular distributed trace spans and structured logs.
- Self-Healing AI System
- An autonomous architecture that detects anomalies and executes remediations without human triage.
- Unit Economics
- Direct revenue generated per request minus exact attributed model inference and infrastructure cost.
- SLA (Service Level Agreement)
- A formal contractual commitment specifying expected availability and latency thresholds.
- Circuit Trip Latency
- The elapsed time from metric anomaly detection to full traffic cutover to fallback baselines.
- Golden Signals Alignment
- Standardizing monitoring across Latency, Traffic, Errors, and Saturation.
Sources and further reading
- Site Reliability Engineering — Monitoring Distributed Systems (the four golden signals) — Google SRE (accessed 2026-08-31)
- Site Reliability Engineering — Evolving SRE Engagement Model (Production Readiness Reviews) — Google SRE (accessed 2026-08-31)
- The Architecture of Open Source Applications: High-Performance Gateways (Brown & Wilson, 2022) — AOSA (accessed 2026-08-30)
Kept in this browser, no account needed. Your progress page turns the whole record into one link you can bookmark or open on another device.