Capstone › Capstone Build II: Ship It › Day 364
Day 364: Capstone Retrospective

Extract findings from your capstone that transfer to the next project: compute how wrong your estimates were and in which direction, check whether that error is uniform or concentrated in one kind of work, rank every incident by where it was caught, and name the specific gate that would have caught each one that reached a user.
Hands-on lab for this lesson
Lab files on GitHub: https://github.com/ai-roadmap-365/ai-roadmap-365.github.io/tree/main/labs/sections/capstone/day-364-capstone-retrospective
- Get the hands-on files. Clone the labs repository once (you can reuse this clone for every lesson). This works on macOS, Linux, and Windows (PowerShell or WSL):
git clone https://github.com/ai-roadmap-365/ai-roadmap-365.github.io.git cd ai-roadmap-365.github.io - Open this lesson's lab. Move into the directory for this specific day. Every lab lives at the same predictable path — section / subsection / week / day:
cd labs/sections/capstone/day-364-capstone-retrospective - Read the lab guide. Open `README.md` in that directory. It lists the exact commands, what each does, the expected output, and how to check your work — read it before running anything.
- Run it and check your work. Follow the README's "How to run" section: run the example first to see the finished result, then complete the numbered exercises in `starter/`, then run the tests. The tests pass (exit 0) only when your work is correct.
bash tests/run_tests.sh # or the test command named in the lab README
You can also open the lab as a local page (works offline, shows the file tree and expected output).
Learning objectives
By the end of this lesson you will be able to:
- Compute a calibration ratio from a project record and explain why the median is used.
- Distinguish a uniform estimation error from a concentrated one, and why the fix differs.
- Explain why an overall median can be a poor predictor of the tasks it covers.
- Rank incidents by detection stage and identify which ones escaped to production.
- Turn each escaped incident into a named gate rather than a general intention.
Prerequisites
Why this matters
Your capstone is built, deployed, monitored, reviewed, documented and described. There is one thing left to extract from it, and it is the part most likely to be skipped: what you now know that you did not know before.
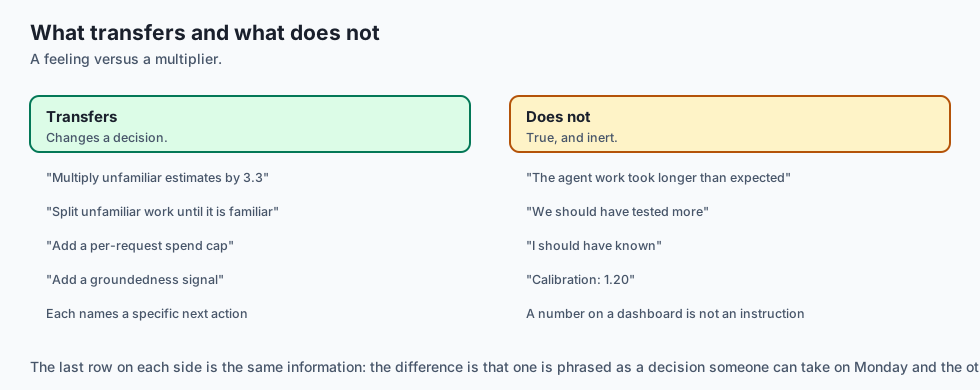
The usual retrospective produces sentences like “the agent work took longer than expected” and “we should have tested more”. Both are true. Neither transfers. Next project you will estimate the same way and be surprised in the same direction, because a feeling about the past does not change a decision in the future.
What transfers is a number. Three of them are computable from records you already have:
How wrong were your estimates, and in which direction? If your work consistently runs twice as long as you predicted, that is a multiplier you can apply immediately.
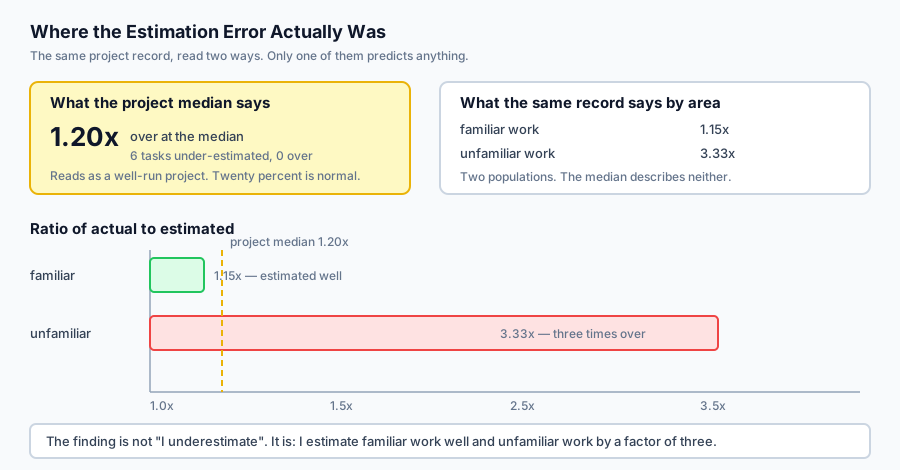
Is the error uniform, or concentrated? This is the question that changes the answer. A project that ran 1.2× over at the median sounds well-estimated — and if the familiar work ran 1.15× and the unfamiliar work ran 3.3×, then applying 1.2× to your next unfamiliar task will be badly wrong. The median hid both numbers.
Which problems reached a user? Every incident was caught somewhere. The ones caught by review or tests cost almost nothing. The ones a person found in production are where the next project’s effort belongs.
Today you compute all three, honestly, from your own project.
The idea in plain language
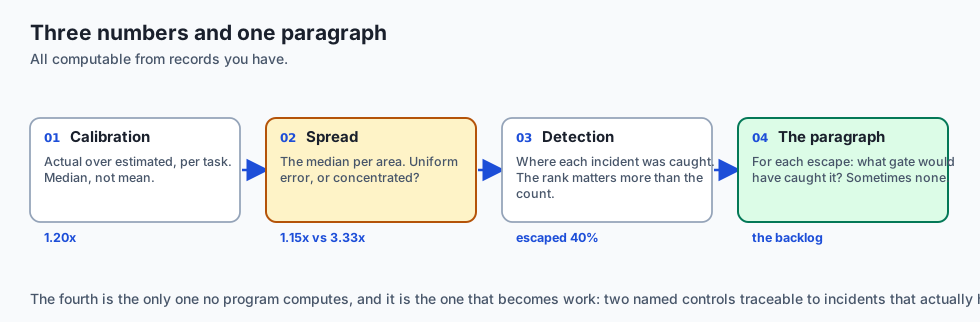
A retrospective that changes behaviour needs three measurements and one honest paragraph.
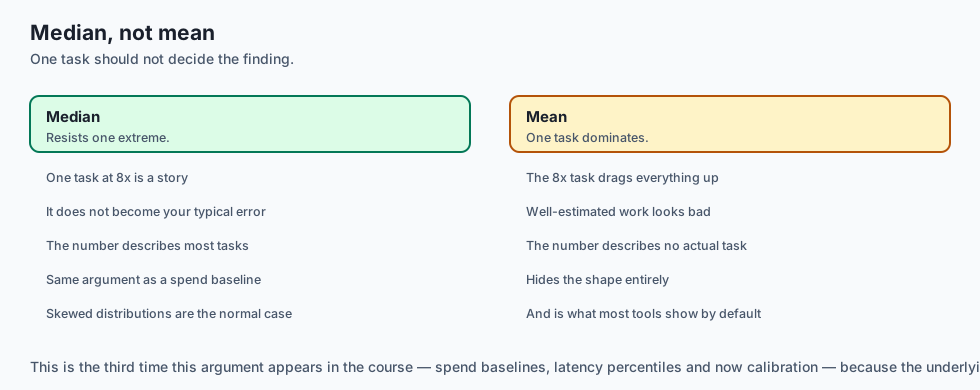
Calibration. For each task, actual divided by estimated. Take the median rather than the mean, because one task that ran eight times over would dominate an average and make everything else look worse than it was.
Spread. Compute the median per area of work — familiar against unfamiliar, backend against frontend, whatever divides your project. If the areas are close, you have a uniform error and a multiplier fixes it. If they are far apart, you estimate one kind of work well and another badly, and a single multiplier will not help.
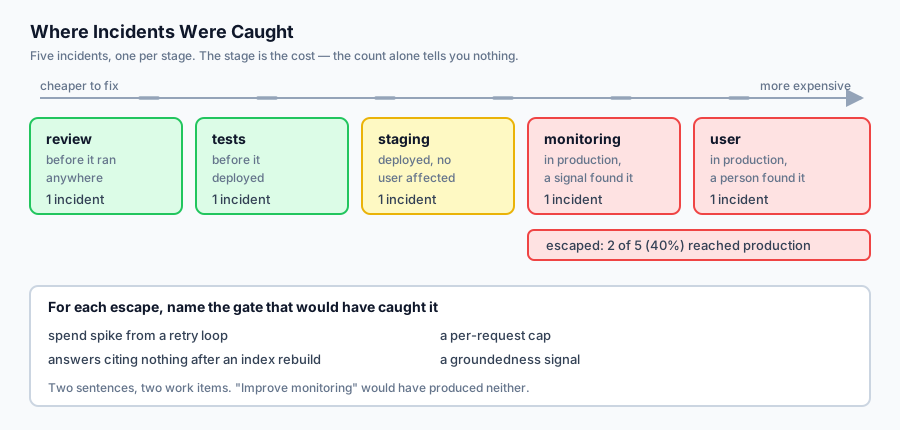
Detection. Sort incidents by where they were caught: review, tests, staging, monitoring, a user. The rank matters more than the count, because each stage is more expensive than the last.
Then the paragraph, which is the part no program computes: for each incident that reached production, what gate would have caught it? Some have an answer, and that answer is next project’s work. Some do not, and saying so is more useful than inventing one.
Historical background
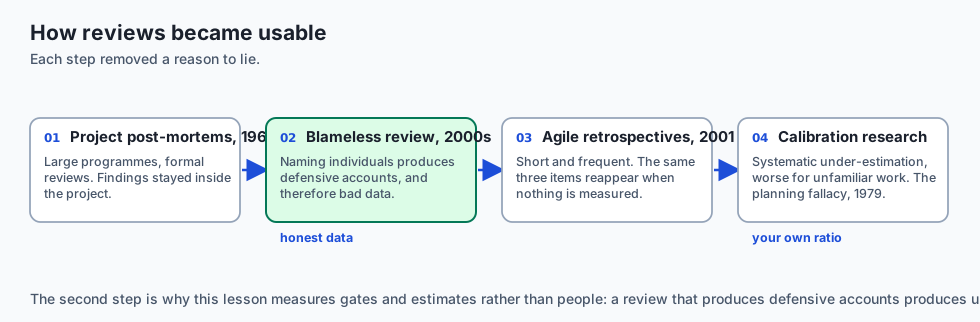
Project post-mortems, 1960s onward
Formal post-project review came from large engineering and defence programmes, where the cost of repeating a mistake justified the meeting. The recurring failure was that findings stayed inside the project that produced them.
Blameless post-mortems, 2000s
Etsy and Google established that a review naming individuals produces defensive accounts and therefore bad data. The reframing — ask what made the mistake possible rather than who made it — is what makes an honest retrospective achievable at all. It is also why this lesson measures gates and estimates rather than people.
Agile retrospectives, 2001 onward
Regular short reviews replaced the single end-of-project meeting, on the sound principle that feedback is more useful when it is close to the work. The common failure mode is well known: the same three items reappear every fortnight because nothing measurable was ever attached to them.
Estimation research
Study after study finds systematic under-estimation, and finds that it is worse for unfamiliar work — an instance of the planning fallacy identified by Kahneman and Tversky in 1979. The useful consequence is that your own historical ratio is a better predictor than your next intuition, and it is a number you already have.
What it is — and what it is not
A retrospective is the extraction of transferable findings from a completed project.
What it is
It is quantitative where it can be. Estimates and incidents are recorded facts, and facts survive the retelling.
It is about systems rather than people. The question is what made the outcome possible.
It is forward-looking. A finding you cannot apply to the next project is an observation, not a finding.
What it is not
It is not a status report. Nobody needs a summary of what happened; they need what it implies.
It is not blame, and not self-blame either. “I should have known” is not a finding, because it does not suggest a different action.
It is not only about failures. A task estimated accurately, and a gate that caught something early, are both worth recording — they tell you what to keep.
Why it was created and what problems it solves
Findings that do not transfer. “It took longer than expected” changes nothing. Solution: a ratio you can multiply the next estimate by.
Averages that hide the shape. A single overall number conceals whether the error is uniform or concentrated. Solution: a median per area, and a check on the spread.
One task distorting everything. Solution: a median rather than a mean.
Incidents treated as equally bad. A bug caught in review and one found by a user are the same bug and very different outcomes. Solution: rank by where it was caught.
Vague improvement plans. “Test more” is not actionable. Solution: for each escaped incident, name the specific gate that would have caught it.
How it works
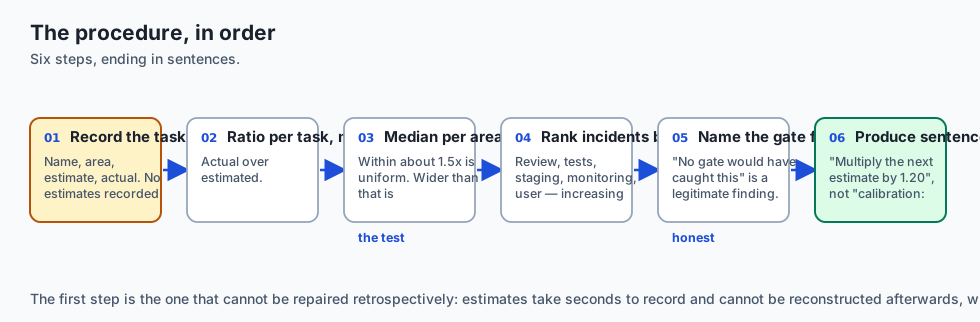
Record the tasks. Name, area, estimate, actual. If you did not record estimates, this is the finding: you cannot calibrate without them, and that is worth fixing before the next project rather than after.
Compute the ratio per task and the median overall. The median is deliberate. One task running eight times over is a story; it is not your typical error.
Compute the median per area, and compare. If the highest area is within about 1.5× of the lowest, the error is uniform. Otherwise it is concentrated, and the overall median is misleading in a specific and important way.
Rank the incidents by detection stage. Review, tests, staging, monitoring, user — in increasing order of cost. Everything from monitoring onwards is an escape: it reached production.
For each escape, name the gate. Some escapes have a clear answer — a spend cap, a groundedness signal, a readiness probe. Those are concrete work items. Some do not, and recording “no gate would have caught this” is a legitimate and useful finding.
Produce sentences, not scores. “Multiply the next estimate by 1.20” is actionable. “Calibration: 1.20” is a number on a dashboard.
An everyday analogy
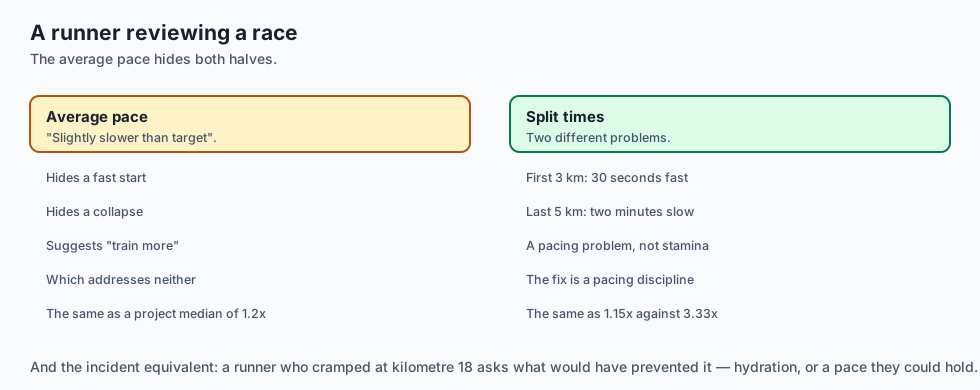
Think of a runner reviewing a race.
The useless review is “it was harder than I expected, I should train more”. True, and it changes nothing, because it does not say which part was hard or what training would address it.
The useful one uses the split times. The first three kilometres were 30 seconds faster than planned; the last five were two minutes slower. That is not a stamina problem, it is a pacing problem, and the fix is a pacing discipline rather than more mileage.
The average pace would have shown neither. It would have said “slightly slower than target” and hidden a fast start and a collapse — the same way a project median of 1.2× hides familiar work at 1.15× and unfamiliar work at 3.3×.
And the incident equivalent: a runner who cramped at kilometre 18 asks what would have prevented it — hydration, or a pace they could hold. “Try harder” is not on that list.
Examples in practice
Here is the measured output from today’s lab, over a capstone’s record:
--- calibration ---
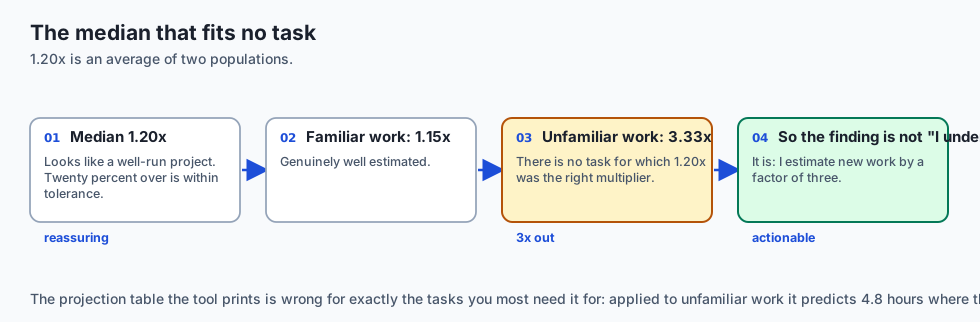
  median ratio 1.20x  under 6 / over 0  worst unfamiliar 3.33x  best familiar 1.15x
  uniform across areas: False
  median ratio by area:
    familiar     1.15x
    unfamiliar   3.33x
Read the first number and then the last two. A median of 1.20× looks like a well-run project — twenty percent over is within anyone’s tolerance.
It is also almost useless as a prediction. The familiar work ran 1.15× and the unfamiliar work ran 3.33×. There is no task in this project for which 1.20× was the right multiplier; it is an average of two populations that behave completely differently.
This is the finding worth carrying, and it is not “I underestimate”. It is: I estimate work I have done before quite well, and work I have not done before by a factor of three. That suggests a specific practice — estimate unfamiliar work by a different method, or split it until the pieces are familiar — which “I underestimate” does not.
--- what a future estimate becomes ---
      4h estimated  ->    4.8h expected
     10h estimated  ->   12.0h expected
     40h estimated  ->   48.0h expected
And note that this table, computed from the overall median, is wrong for exactly the tasks you most need it for. Applying it to unfamiliar work would predict 4.8 hours where the record says 13. The tool computes it; the lesson is knowing when not to use it.
--- detection ---
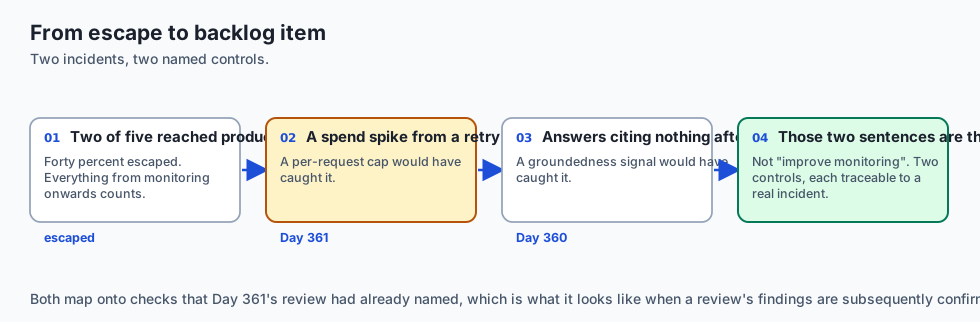
  review=1 tests=1 staging=1 monitoring=1 user=1  escaped=2 (40%)

--- findings ---
  - 'spend spike from a retry loop' reached production and a per-request cap
    would have caught it.
  - 'answers citing nothing after an index rebuild' reached production and a
    groundedness signal would have caught it.
Two of five incidents reached production, and both have a named gate. Those two sentences are the next project’s backlog — not “improve monitoring”, but two specific controls, each traceable to an incident that actually happened.
Implications: security, privacy, performance, scalability, and cost
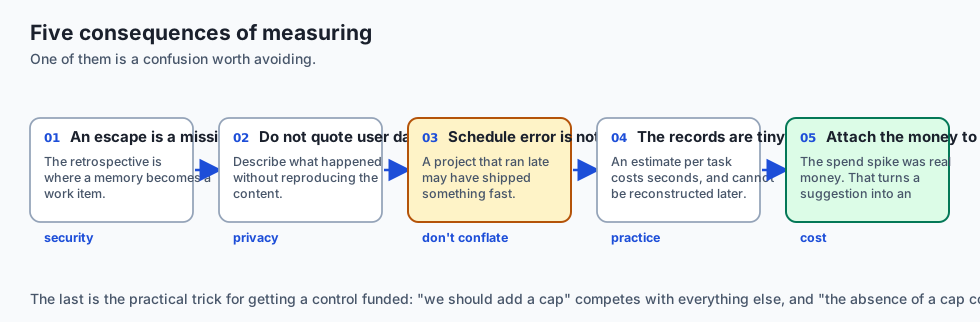
Security. An escaped incident is a control that was missing, and the retrospective is where that becomes a work item rather than a memory. Both escapes here map onto Day 361’s checks — a spend cap and a quality signal — which is what it looks like when a review’s findings are confirmed by events.
Privacy. A retrospective that quotes incidents may quote user data. Describe what happened without reproducing the content, particularly if the write-up will be published.
Performance. Calibration explains schedule error rather than system performance. Do not conflate them: a project that ran late may have shipped something fast.
Scalability of the practice. This works because the records are small. Recording an estimate per task costs seconds and is the only input that cannot be reconstructed afterwards.
Cost. The escaped incidents usually have a direct cost attached — the spend spike here is money that was actually spent. Attaching that figure to the finding is what turns “we should add a cap” into a decision someone will approve.
Alternatives: free, open source, and commercial
A written document in the repository — free, versioned beside the code, and readable by whoever picks the project up. For a capstone this is the right answer.
Issue trackers — GitHub Issues and equivalents let each finding become a task with an owner. The advantage over a document is that a finding which is not acted on stays visible.
Incident management tools — Jeli, incident.io and similar are built around structured post-incident review with timeline reconstruction. Aimed at teams with ongoing incident volume.
Estimation tracking — most project tools record estimate against actual, which is the input to calibration. If yours does, the number is already available and nobody has looked at it.
Structured formats — a template with prompts (what was expected, what happened, what would have caught it) is a cheap and effective intervention, because the prompts do the remembering.
The honest default for a capstone: a written retrospective in the repository, with the three numbers computed and every escaped incident named alongside the gate that would have caught it.
Comparison with related concepts
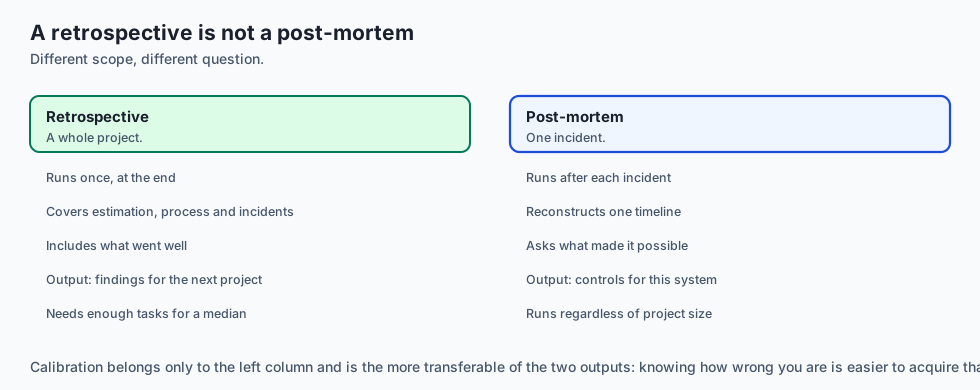
Retrospective versus post-mortem. A post-mortem examines one incident. A retrospective examines a whole project, including what went well.
Calibration versus estimation skill. Calibration is knowing how wrong you are. It is more useful and much easier to acquire than being right, and it does not require you to become a better estimator at all.
Median versus mean. For ratios and durations, the median resists a single extreme value. This is the same argument as Day 360’s spend baseline, and it recurs because skewed distributions are the normal case.
Escaped versus caught. Every incident was caught somewhere. What matters is how far right it got, because the cost rises at every stage.
When to use it — and when not to
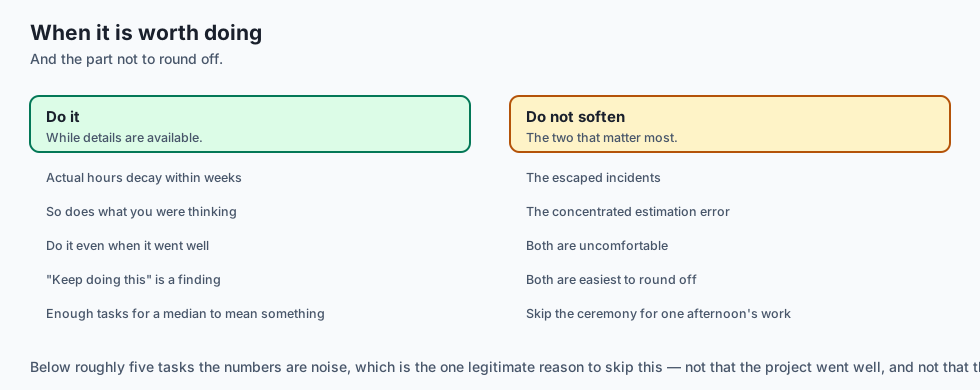
Do it while the details are available. Actual hours, and what you were thinking when you estimated, decay within weeks.
Do it even when the project went well. A project with accurate estimates and no escapes tells you what to keep, and “keep doing this” is a finding.
Skip the ceremony if the project was one afternoon. The value comes from having enough tasks for a median to mean something. Below roughly five, the numbers are noise.
Do not skip the uncomfortable part. The escaped incidents and the concentrated error are the two findings most worth having, and both are the ones easiest to round off into something more flattering.
The AI connection
-
AI projects estimate badly in a specific, predictable place. The model call is quick; the evaluation, the retrieval tuning and the failure handling are not.
-
The unfamiliar-work multiplier is the finding that transfers. Almost every part of an AI system is unfamiliar the first time, which is where 3.3x comes from.
-
Escaped incidents in AI systems are usually silent ones — a spend spike or ungrounded answers, neither of which raises an error rate.
-
Both escapes here map onto Day 361’s checks, which is what it looks like when a security review’s findings are later confirmed by events.
-
Calibration beats estimation skill. Knowing you run 3.3x over on new work is more useful, and far easier to acquire, than learning to predict it correctly.
Knowledge check
- A project’s median estimation ratio is 1.20×. Why might that number be useless as a prediction?
- Why does calibration use a median rather than a mean?
- Why rank incidents by where they were caught rather than counting them?
- Why is “no gate would have caught this” a legitimate finding rather than a failure to analyse?
- Why is knowing how wrong your estimates are more useful than becoming a better estimator?
Hands-on exercise
You will compute calibration, spread and detection from a project record, and turn them into sentences that transfer.
Open starter/retro.py in the lab directory and implement the stubbed functions, then run the tests.
Expected output
Running python3 examples/retro_demo.py analyses a capstone’s record:
--- calibration ---
  median ratio 1.20x  under 6 / over 0  worst unfamiliar 3.33x  best familiar 1.15x
  uniform across areas: False
  median ratio by area:
    familiar     1.15x
    unfamiliar   3.33x
--- detection ---
  review=1 tests=1 staging=1 monitoring=1 user=1  escaped=2 (40%)
--- findings ---
  - Estimates ran 1.20x long at the median. Multiply the next one by 1.20 before
    committing to it.
  - The error is concentrated, not uniform: unfamiliar ran 3.33x while familiar
    ran 1.15x. A single multiplier will not fix this.
  - 2 of 5 incidents reached production (40%).
  - 'spend spike from a retry loop' reached production and a per-request cap
    would have caught it.
The second finding contradicts the first, deliberately. Both are true, and the second is the one that changes what you do.
Validate your work
Run bash tests/run_tests.sh. All twenty-two tests must pass, grouped by what the retrospective computes.
Then check two behaviours by inspection. A record where every task ran exactly twice as long must report a median of exactly 2.00 and uniform: True. And a clean record — accurate estimates, no escapes — must say so rather than manufacturing a finding.
Troubleshooting
One task dominates the calibration. You are using a mean. Use the median.
is_uniform returns True for the concentrated fixture. Your comparison is against the overall median rather than between the highest and lowest areas. Compare the areas to each other.
Every incident counts as escaped. Only monitoring and user detections are escapes — staging is deployed but reached nobody.
A zero estimate crashes the ratio. A task with no estimate is a real case. Return 0.0 rather than dividing.
Common mistakes
Producing scores rather than sentences. A number on a dashboard is not a finding.
Averaging away the shape, which loses the single most useful thing in the record.
Treating all incidents as equal when the cost rises sharply at every stage.
Writing findings about people. “I should have been more careful” suggests no different action next time.
Practice assignment
Add estimate-size analysis: group tasks by the size of the original estimate — under two hours, two to eight, over eight — and compute a median ratio for each.
Then write a test proving the checker can distinguish a project where large estimates are worse from one where small ones are. This matters because the two have opposite fixes: if large estimates are worse, break work down further; if small ones are worse, you are underestimating fixed overheads that do not scale down.
Extension challenge
Run this over your own capstone, with the real numbers.
Then do the part that is not mechanical: for every incident that reached production, decide honestly whether a gate would have caught it — and resist inventing one. “No gate would have caught this; it was a genuine unknown” is a legitimate and valuable finding, and manufacturing a plausible-sounding control to avoid writing it produces a backlog item that fixes nothing.
Report the split: how many escapes were preventable, and how many were not. If everything looks preventable in hindsight, you are almost certainly hindsight-biasing, and the useful question is what you would have needed to know at the time to justify building that gate before the incident rather than after.
Quiz
Q1. A project's median estimation ratio is 1.20x. Why might that number be useless as a prediction for the next task?
- Because a sample of one project is never enough to predict anything
- Because 1.20x is within normal variance and therefore not a finding
- Because estimation ratios should always be reported as percentages
- It can average two populations that behave differently
Show answer
Answer: D. It can average two populations that behave differently
The overall median is a real number about the project and a poor description of any task in it. Splitting by area is what shows whether the error is uniform.
Q2. Why does calibration use the median of the task ratios rather than the mean?
- One eight-fold overrun would dominate a mean
- Because the median is faster to compute on large projects
- Because means require a normal distribution and ratios are always normal
- Because the mean cannot be computed when any estimate is zero
Show answer
Answer: A. One eight-fold overrun would dominate a mean
Duration ratios are skewed by a small number of very bad tasks. The median describes the typical task, which is what you are trying to predict.
Q3. Why rank incidents by where they were caught rather than simply counting them?
- Because counting incidents is impossible without a tracker
- The same defect costs more the further right it escapes
- Because incidents caught in review are not real incidents
- Because a lower count is always the goal of a retrospective
Show answer
Answer: B. The same defect costs more the further right it escapes
Every incident was caught somewhere. A bug found in review and the same bug found by a user are identical in count and completely different in cost.
Q4. Why is "no gate would have caught this" a legitimate finding rather than a failure to analyse?
- Because it means the incident was somebody else's fault
- Because unknown incidents do not need to be recorded at all
- An invented control prevents nothing
- Because it proves the existing gates are already sufficient
Show answer
Answer: C. An invented control prevents nothing
Hindsight makes almost everything look preventable. The honest test is what you would have needed to know at the time to justify building the gate before the incident.
Q5. Why is knowing how wrong your estimates are more useful than becoming a better estimator?
- Because estimation skill cannot be improved by anyone
- Because a calibrated estimate is guaranteed to be correct
- Because managers only ever ask for the multiplier
- Calibration is measurable now; intuition is slow
Show answer
Answer: D. Calibration is measurable now; intuition is slow
Calibration turns your own history into a correction you can apply today. It does not require your next intuition to be any better than your last one.
Glossary
- Retrospective
- The extraction of transferable findings from a completed project. Distinct from a status report, which describes what happened without saying what it implies.
- Calibration
- How wrong your estimates are and in which direction, expressed as actual divided by estimated. Knowing it is a different skill from estimating accurately, and an easier one.
- Estimation Ratio
- Actual hours over estimated hours for one task. 1.0 is exact, 2.0 means the task took twice as long as predicted.
- Uniform Error
- An estimation error spread evenly across areas of work. It can be corrected with a single multiplier applied to the next estimate.
- Concentrated Error
- An estimation error that lives in one kind of work — typically the unfamiliar kind. The overall median hides it, and no single multiplier fixes it.
- Detection Stage
- Where an incident was caught — review, tests, staging, monitoring or a user — ordered by how much the fix cost at that point.
- Escaped Incident
- One that reached production, whether a signal or a person found it. These are the incidents worth spending the next project's effort on.
- Preventable Escape
- An escaped incident for which a specific gate can be named. Distinguishing these from genuine unknowns is what stops a retrospective becoming a list of intentions.
- Blameless Review
- A review that asks what made an outcome possible rather than who caused it. Naming individuals produces defensive accounts and therefore unreliable data.
- Planning Fallacy
- The systematic tendency to underestimate how long a task will take, identified by Kahneman and Tversky, and consistently worse for work you have not done before.
- Hindsight Bias
- The tendency to see an outcome as more predictable after it happened. In a retrospective it shows up as every escape looking preventable.
Sources and further reading
- Postmortem Culture — Learning from Failure — Google — Site Reliability Engineering (accessed 2026-08-31)
- Blameless PostMortems and a Just Culture — Etsy — Code as Craft (accessed 2026-08-31)
- Intuitive Prediction — Biases and Corrective Procedures — Kahneman and Tversky, 1977 (accessed 2026-08-31)
- Retrospective Plans and Activities — Retromat (accessed 2026-08-31)
- Software Development Effort Estimation — A Review of Estimation Accuracy — Simula Research Laboratory (accessed 2026-08-31)
Kept in this browser, no account needed. Your progress page turns the whole record into one link you can bookmark or open on another device.