Programming with Python › Data Formats and Pipelines › Day 97
Day 97: Logging and Configuration
After this lesson you will be able to take a script whose every line of commentary is a print statement and turn it into a program whoever is awake when it breaks can actually read — naming the four objects the logging module is built from and saying which of them can drop a record and why nothing errors when one does; diagnosing the two-level trap where a logger at DEBUG and a handler at WARNING silently swallow every debug line; reproducing the duplicate-message problem propagation causes and fixing it two ways, knowing which fix belongs in a library and which in an application; choosing between the five levels by asking who the line is for rather than how alarming it feels; using exception() inside an except block and stating exactly what error(str(e)) throws away; using lazy percent-s formatting and measuring what it saves; writing a JSON formatter and querying the result with nothing but the standard library; writing a redacting filter, attaching it where it actually works rather than where it looks right, and proving the secret appears nowhere in captured output — including the two holes measured while this lesson was written, that a filter on a logger does not protect records from child loggers and that a secret inside an exception message survives every filter; configuring the lot from one dictConfig dictionary; rotating files by size and by time while being able to argue why stdout plus a supervisor is usually better; and then building, from scratch, a four-layer configuration resolver — defaults, TOML file, environment, command-line flags — in which every setting reports both its value and the layer it came from, telling a missing environment variable from an empty one, refusing to believe that the string "false" is true, keeping every secret out of the log and off the command line, and validating the whole thing at startup with messages that name both the setting and the one of four places to go and fix it.
Hands-on lab for this lesson
Lab files on GitHub: https://github.com/ai-roadmap-365/ai-roadmap-365.github.io/tree/main/labs/sections/programming-with-python/day-097-logging-and-configuration
- Get the hands-on files. Clone the labs repository once (you can reuse this clone for every lesson). This works on macOS, Linux, and Windows (PowerShell or WSL):
git clone https://github.com/ai-roadmap-365/ai-roadmap-365.github.io.git cd ai-roadmap-365.github.io - Open this lesson's lab. Move into the directory for this specific day. Every lab lives at the same predictable path — section / subsection / week / day:
cd labs/sections/programming-with-python/day-097-logging-and-configuration - Read the lab guide. Open `README.md` in that directory. It lists the exact commands, what each does, the expected output, and how to check your work — read it before running anything.
- Run it and check your work. Follow the README's "How to run" section: run the example first to see the finished result, then complete the numbered exercises in `starter/`, then run the tests. The tests pass (exit 0) only when your work is correct.
bash tests/run_tests.sh # or the test command named in the lab README
You can also open the lab as a local page (works offline, shows the file tree and expected output).
Learning objectives
By the end of this lesson you will be able to:
- Name the four objects the logging module is built from — logger, handler, formatter, filter — say what each one does, and trace one call through all of them
- Diagnose the two-level trap, in which a record must pass the logger's level AND each handler's level, and explain why a logger left at NOTSET is effectively at the root's WARNING
- Reproduce the duplicate-message problem caused by propagation up the dotted hierarchy, fix it two ways, and say which fix belongs in a library and which in an application
- Choose between DEBUG, INFO, WARNING, ERROR and CRITICAL by asking who the line is for and what they do about it, and name the failure mode called level inflation
- Use exception() inside an except block, and state the two things error(str(e)) throws away — the traceback and the exception type
- Use lazy percent-s formatting, measure what it saves for a suppressed record, and give the second reason that applies even when the record is emitted
- Write a JSON formatter as a subclass with one method, and query the resulting log with nothing but the json module and a loop
- Write a redacting filter that scrubs by value across the message, the arguments and nested extra fields, and attach it to each handler rather than to a logger — with the measurement that explains why
- Explain why a secret inside an exception message survives a redacting filter, and give both the rendering-level fix and the better source-level one
- Configure logging from a single dictConfig dictionary with two handlers and two formatters, and avoid the disable_existing_loggers trap
- Use RotatingFileHandler and TimedRotatingFileHandler, say what backupCount actually deletes, and argue honestly for stdout plus a supervisor as the usual better answer
- Build a four-layer configuration resolver — default, config file, environment, flag — and justify that ordering by specificity
- Record the provenance of every resolved value and print it as a table, so that "why is it doing that?" takes five seconds
- Read TOML with tomllib in binary mode, and explain what a typed file format gives you that the environment cannot
- Convert environment strings to real types with an explicit word table, having seen that bool("false") is True, and distinguish a missing variable from an empty one
- Validate configuration at startup, reporting every problem at once with messages that name both the setting and the layer its value came from
- Keep a secret out of the log, out of the provenance table, out of the validation messages and off the command line, and say why a command-line flag is the wrong place for one
- Compare the stdlib against structlog, loguru, python-json-logger, pydantic-settings, python-dotenv and dynaconf with when to choose each — and say which were actually run here and which were only described
Prerequisites
- Day 43 — a working python3 on your PATH; Python 3.11 or newer, because the configuration half reads TOML with tomllib
- Day 59 — modules, imports and __name__, which is exactly what logging.getLogger(__name__) depends on and what makes the dotted hierarchy line up with your package layout
- Day 65 — JSON, which is what a structured log line is made of
- Day 66 — exceptions and try/except, without which exception() and exc_info have nothing to attach
- Day 68 — inheritance and dunder methods; a formatter and a filter are each one subclass overriding one method
- Day 69 — dataclasses and type hints, used for the Setting and Resolved records
- Day 80 — argparse, which supplies the highest-precedence configuration layer
- Day 81 — scheduling and background jobs, where the argument for logging to stdout and letting the supervisor collect it was first made
- Day 84 — the automation toolkit, which is the program this day's configuration resolver was missing
- Day 91 — ISO 8601 as a text format that sorts chronologically, reused here for every timestamp
- Day 94 — pydantic, which is the foundation pydantic-settings builds the configuration answer on
- Day 95 — dates, times and time zones, which is why every timestamp in this lesson is UTC
Why this matters
Here is a script that works. It is six lines long and there is nothing wrong with it.
print("starting preparation")
print("using API key " + API_KEY)
print("processing record " + str(record["id"]))
print("skipping record " + str(record["id"]) + ": empty text")
print("kept " + str(len(kept)) + " of " + str(len(records)) + " records")
print("done")
You run it on your laptop. You watch the lines go past. They tell you exactly what you wanted to know. This is not a bad program and the person who wrote it was not careless.
Tomorrow it runs at 04:00 on a machine you have no terminal on. It runs again at 05:00. Its output is appended to a file that already holds one hundred and sixty-seven other runs from this week. At 09:20 somebody who is not you opens that file, because a downstream report has the wrong number in it, and they need to know what happened.
Every one of those six lines is now useless, and each fails differently.
processing record 3 — which run? There are a hundred and sixty-eight of them in that file and they are textually identical. There is nothing to filter on, nothing to group by, no way to say “show me only Tuesday’s 04:00 run”.
skipping record 2: empty text — when? No timestamp. The line above it might be from three hours earlier. Ordering within one file is not enough, because two runs interleave the moment anything runs in parallel.
could not write output — how bad? It is exactly the same shape of text as processing record 3. grep cannot tell them apart, so no alerting rule can either, so nobody was woken and nobody was emailed, and the failure sat there for five hours.
All six — how do you turn them down? You edit the source and you deploy. That is the only mechanism there is, because the decision to print is baked into every call site. And “edit the source and deploy” is exactly the change nobody wants to make while something is already broken.
And line 2 is a security incident. The API key is now in the terminal scrollback, in the log file, in whatever CI job captured stdout, and in the ticket somebody pastes it into at 09:25. Not a lint failure. An incident, with a rotation, a disclosure conversation, and an audit of everywhere that file was copied to — and log files are the most-copied artifact a running system produces.
The sentence this whole day hangs on is this one:
They are different jobs. print is a debugging aid with a lifetime of about four minutes; a log is evidence with a lifetime of months, read by a stranger under time pressure who cannot ask you anything.
Then the second half, which is the same idea pointed the other way. Logging is how the program tells you what it did. Configuration is how you tell the program what to do. And it has the identical failure mode: when nobody can answer “why is it doing that?”, the reason is almost never mysterious. It is that a value came from one of four places and nothing recorded which.
For AI work specifically, and this is not a stretch: a training run you cannot reconstruct is an anecdote, not a result. The hyperparameters are configuration. The data version is configuration. The seed is configuration. The model name and the prompt template are configuration. And the run log is the only evidence that survives of what actually happened. If your evaluation number is good and you cannot say which data snapshot produced it, you have a number, not a finding — and the next person to try will get a different number and neither of you will know why.
The idea in plain language
The logging module has a reputation for being confusing. It is not confusing; it is four separate objects, and every single confusing thing about it follows from people believing it is one object.
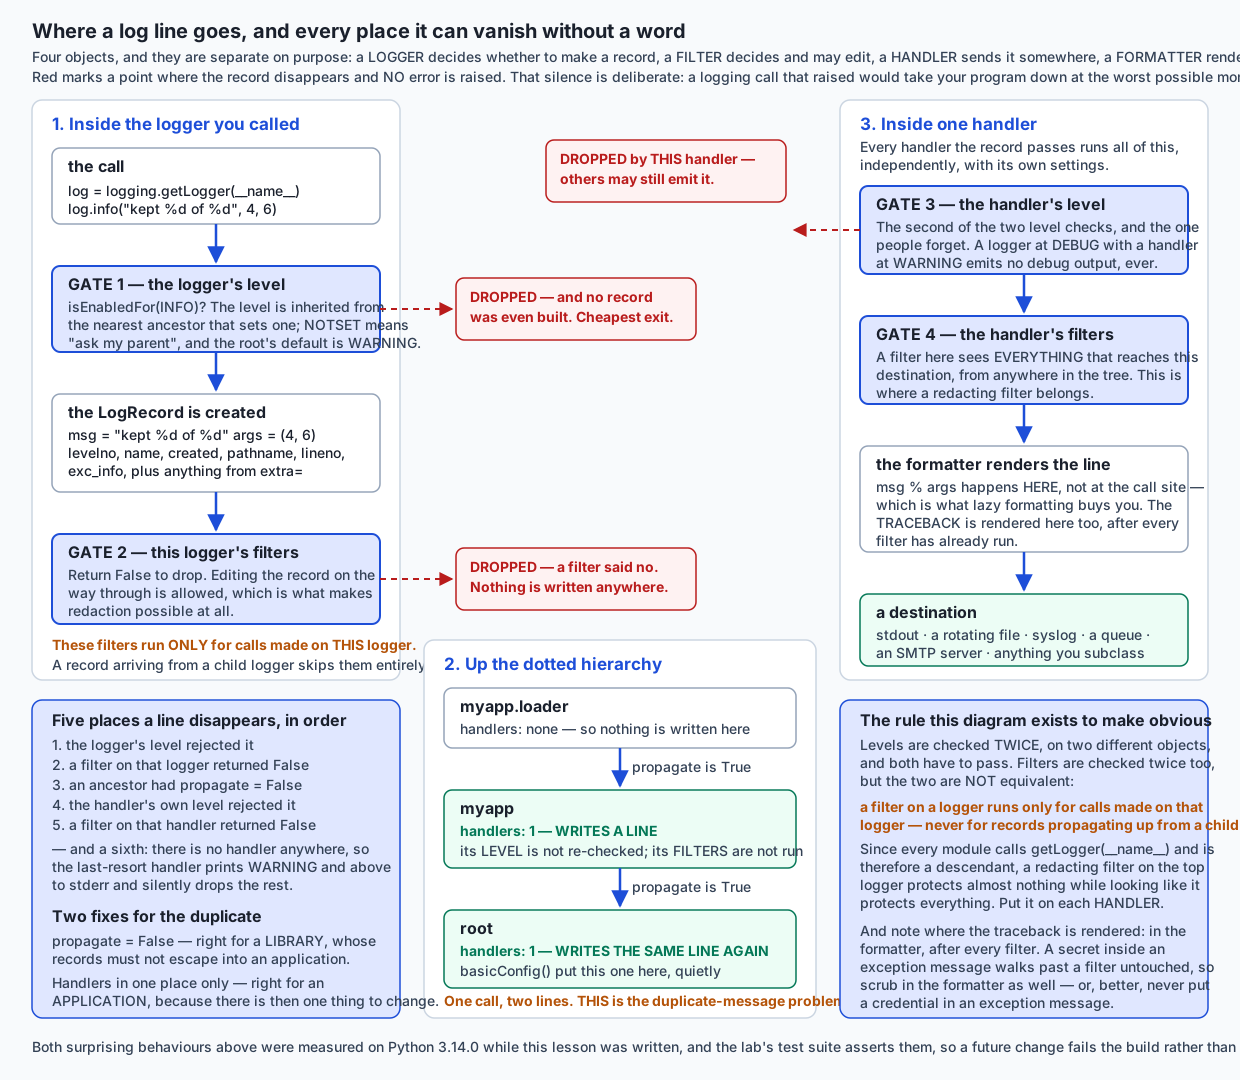
A logger is the thing you call. It has a name, and the names are dotted, so myapp.loader is a child of myapp which is a child of the root. It has a level, and that level is the first gate.
A handler is a destination. Standard output. A file. A rotating file. A syslog socket. A queue. A logger can have several, and each handler has its own level, which is the second gate.
A formatter turns a record into text. It belongs to a handler, not to a logger, which is why the same call can appear as a friendly line on your console and as a JSON object in a file, at the same moment, with no code change.
A filter decides whether a record continues, and — this is the part that gets used in practice — may edit it on the way through. That is what makes redaction possible at all.
Now follow one call and every surprising behaviour falls out of the picture.
You write log.info("kept %d of %d", 4, 6) on myapp.loader. First the logger’s level is checked. If INFO is below it, nothing happens: no record is built, nothing is formatted, no argument is even rendered. That is the cheapest possible exit and it is why lazy formatting matters.
If it passes, a LogRecord is created — a plain object holding the template, the arguments, the level, the logger’s name, the timestamp, the file and line, and whatever you passed through extra=. Note what it is not: it is not a string yet. Nothing has been formatted.
Then this logger’s filters run. Then the record walks up the hierarchy — myapp.loader, myapp, root — and every handler it passes emits it. This is propagation, and it is where duplicates come from: a handler on myapp and a handler on the root means one call and two lines.
At each handler, the handler’s level is checked, then the handler’s filters run, then the formatter renders the text, then it is written.
Two things in that walk are not what people assume, and both were measured while this lesson was written rather than taken on trust.
The ancestors’ levels are not re-checked on the way up — only their handlers are used. So myapp set to WARNING does not stop a DEBUG record from myapp.loader reaching myapp’s handler.
The ancestors’ filters are not applied at all. A filter on myapp runs for calls made on myapp and for nothing else. Since every well-behaved module calls logging.getLogger(__name__) and is therefore a descendant, a redacting filter placed on your top-level logger protects almost nothing while looking like it protects everything. Put it on each handler.
The configuration half is simpler and has one idea in it: four layers, in precedence order, and every value remembers which layer it came from.
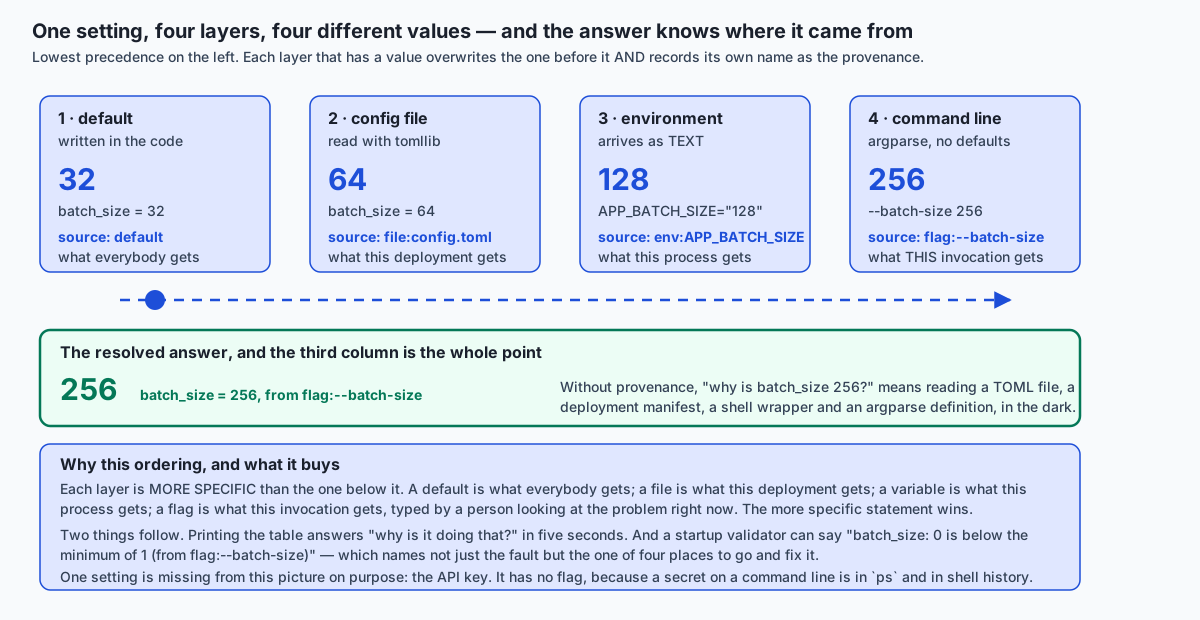
Defaults in the code, then a config file, then environment variables, then command-line flags. Each layer that has a value overwrites the one below it and records its own name. So the resolved answer is not 256; it is 256, from flag:--batch-size. Those are different facts and only the second one is useful at 03:00.
Historical background
Both halves of today have a specific origin, and knowing them stops the design feeling arbitrary.
Severity levels are older than Python by two decades. They come from syslog, written by Eric Allman in the early 1980s as part of Sendmail at Berkeley, and they were so obviously useful that everything else adopted them. Syslog was not formally specified until RFC 3164 in 2001 — which documented existing practice rather than defining it — and was properly standardised as RFC 5424 in 2009.
RFC 5424 defines eight severities, and they are worth seeing because Python’s five are a deliberate subset:
| Syslog code | Name | Python’s equivalent |
|---|---|---|
| 0 | Emergency: system is unusable | — |
| 1 | Alert: action must be taken immediately | — |
| 2 | Critical: critical conditions | CRITICAL (50) |
| 3 | Error: error conditions | ERROR (40) |
| 4 | Warning: warning conditions | WARNING (30) |
| 5 | Notice: normal but significant | — |
| 6 | Informational | INFO (20) |
| 7 | Debug | DEBUG (10) |
Note the direction, because it catches everybody once: in syslog a lower number is more severe; in Python a higher number is more severe. Python’s numbers go up in tens precisely so you can insert your own level between two of them, which is occasionally the right thing to do and usually is not.
Python’s logging module arrived in Python 2.3 (2003), designed by Vinay Sajip and specified in PEP 282, with Trent Mick as co-author. Its architecture — separate loggers, handlers, formatters and filters, with a dotted hierarchy and propagation — is openly modelled on log4j, the Java logging framework created by Ceki Gülcü. That inheritance explains a great deal about the module, including the parts people find un-Pythonic: the camelCase method names like setLevel and addHandler are log4j’s, and they have been kept for twenty years because breaking them would break every Python program ever written.
dictConfig — configuring the whole thing from one dictionary — came later, in Python 2.7 and 3.2 (2010-2011), specified in PEP 391, also by Vinay Sajip. The motivation is worth noting because it is exactly today’s theme: the older fileConfig used a bespoke INI format that could not express everything the API could, and a dictionary can come from JSON, from YAML, or — as of Python 3.11 — from TOML, which means your logging configuration can live in the same file as the rest of your configuration and be diffed in review like any other data.
On the configuration side, the document that shaped current practice is The Twelve-Factor App, written by Adam Wiggins and published in 2011 while he was at Heroku. Its third factor is titled Config, and its argument is one sentence long: store configuration in the environment. The reasoning is that configuration is what varies between deployments — staging against production, your laptop against the cluster — while code is what does not, and the two must therefore not be mixed. It is the reason environment variables are a layer at all rather than an afterthought, and it is also, as we will see, wrong about a couple of things.
And tomllib, the standard library’s TOML reader, arrived in Python 3.11 (2022). TOML itself was created by Tom Preston-Werner in 2013, explicitly as a configuration format — which is why it has real types, real dates, and no execution semantics whatsoever.
What it is — and what it is not
Logging is the practice of emitting a stream of structured, severity-tagged, timestamped events from a running program, to destinations chosen by configuration rather than by the code that emits them.
Read that definition again with the emphasis on the last clause, because it is the whole difference from print. The call site says what happened and how bad it is. It does not say where the message goes, whether it is written at all, or what it looks like. Those three decisions belong to configuration, and moving them there is what makes the same program debuggable on your laptop and quiet in production without a single edit.
Configuration is the set of values that vary between deployments of the same code, resolved once at startup, from layered sources, with validation.
Both definitions carry a lot of weight in the small words. “Resolved once at startup” rules out reading os.environ in the middle of a function, which is how a program ends up behaving differently in two places for reasons nobody can find. “With validation” rules out discovering that BATCH_SIZE=0 is a problem at 03:00 rather than at deployment.
Now what these things are not.
Logging is not print with extra steps. The mechanical difference is a level and a timestamp. The structural difference is that the decision about what is worth seeing has moved out of the source code. That difference is what lets an operator ask for INFO and above without a deployment, and what lets you ask for DEBUG on one module for ten minutes while you hunt something.
Logging is not tracing, and it is not metrics. A log line is an event with text. A metric is a number over time — how many requests, how long, how many failed — and answering “is it slow?” from log lines means counting them, which is the wrong tool. A trace follows one request through several services and stitches the spans together. All three are useful; they are not substitutes; and a log that is really a metric in disguise (log.info("latency was %f", t) a million times) is expensive and hard to query.
Logging is not an audit trail. An audit trail has legal or compliance requirements about completeness, immutability and retention. Logs get rotated away, dropped under load, and lost when a container dies. If you need to prove that something happened, write it to a durable store, in a transaction, deliberately.
A log is not a debugger. If you can attach a debugger, attach a debugger. Logging is what you have on a machine where you cannot.
Configuration is not code. This is the rule that matters most for security. A configuration file must be data, parsed by a parser — TOML, JSON, YAML. Configuring a program by importing a Python file is arbitrary code execution with extra steps, and it looks harmless right up until the file comes from somewhere you did not expect.
Configuration is not secrets management. Secrets are configuration in the sense that they vary per deployment, and they are emphatically not configuration in the sense that they can live in a file in your repository. A secrets manager gives you rotation, expiry and access logs. An environment variable gives you none of those, and is still much better than a file in the repository.
Configuration is not feature flags. Feature flags change at runtime, per user, without a restart, and they have their own machinery. Everything today resolves once at startup and then does not change, which is a simplification you should make deliberately rather than by accident.
| It is | It is not |
|---|---|
| A stream of severity-tagged events with a queryable shape | print with a timestamp bolted on |
| Four objects — logger, handler, formatter, filter | One object with a lot of methods |
| Configured at the edge of the program, once | Configured at every call site |
| Values resolved from layers, with provenance recorded | One os.environ.get per question, scattered |
| A parser reading a data file | An import of a Python module named settings |
| A seatbelt against a secret escaping | Permission to log the secret |
Why it was created and what problems it solves
The logging module exists because everybody had already written the worse version of it, badly, six times.
Before it, every serious Python project had a module called log.py with a function called log_message that took a string and a number, checked a global, and wrote to a file. They were all subtly different, none of them composed, and when you imported two libraries that each had one you got two log files with two formats and no way to line them up. That is precisely the problem log4j had solved for Java, and PEP 282’s argument was largely “let us have that, once, in the standard library, so libraries can log without imposing anything on the application that uses them”.
That last clause is the design constraint that explains the whole architecture, and it is worth stating plainly because it is not obvious:
A library must be able to emit log records without deciding where they go. An application must be able to decide where all records go without knowing which libraries emitted them.
The dotted hierarchy and propagation exist to satisfy exactly that. A library calls logging.getLogger(__name__) and logs. It attaches no handler, chooses no format, opens no file, and — critically — configures nothing globally. The records propagate up to the root, where the application has attached a handler, and the application’s choice wins for everything. The library has no opinion and needs none.
This is also why the duplicate-message problem exists. It is not a bug; it is the price of that design. If handlers did not accumulate up the tree, an application could not catch a library’s records at the root. Since they do, adding a handler both to your own logger and to the root gives you two copies of everything.
The configuration half solves a different pain with a similar shape. The Twelve-Factor argument was made against a specific bad practice that was normal in 2011: shipping config/production.py, config/staging.py and config/development.py inside the repository and choosing between them with an import. Three problems, all of them real:
- The secrets are in the repository. Forever, in the history, in every clone, in every backup, after somebody deletes the line.
- Adding a deployment means editing code. A new environment needs a new file and a release.
- The mapping from deployment to configuration lives in the code, so you cannot change one without changing the other, which is the definition of coupling.
Environment variables fix all three: they are set outside the code, per process, by whatever launches it, and nothing about them is committed.
What layering adds on top is the ability to be specific without being repetitive. Defaults mean the program runs with nothing set. A file means the team shares the boring values without typing them. The environment means the deployment differs. A flag means this run right now differs, because somebody is standing at a terminal trying something.
And provenance — the part that most implementations skip — solves the failure that costs the most time in practice. Not “the value is wrong”, which you notice quickly. “The value is not what I set it to, and I have four places to look.” Recording where each value came from turns a twenty-minute archaeology exercise into printing a table.
How it works
The two-level rule, and the message that vanishes
This is the single most common logging question there is, so it goes first.
log = logging.getLogger("trap")
log.setLevel(logging.DEBUG)          # the logger will accept DEBUG

handler = logging.StreamHandler(stream)
handler.setLevel(logging.WARNING)    # the handler will not emit it
log.addHandler(handler)

log.debug("this vanishes")
log.info("so does this")
log.warning("this gets through")
Three calls. One line of output. Captured from the lab:
logger level:  DEBUG   (logging.getLogger('trap').level -> DEBUG)
handler level: WARNING (log.handlers[0].level -> WARNING)
--- three calls were made; this is what came out ---
WARNING  trap             this warning gets through
No error. No warning about the warning. The two dropped records simply did not happen.
The rule is: a record must pass the logger’s level AND then each handler’s level, and they are different objects. People set the logger to DEBUG, see nothing, and conclude that logging is broken. Logging is doing exactly what it was told by two different instructions, one of which they did not give.
The diagnostic is three lines and worth memorising:
print(logging.getLevelName(log.level),
      [logging.getLevelName(h.level) for h in log.handlers],
      log.propagate)
A related trap: a logger whose level is NOTSET (which is the default, and is 0) does not mean “log everything”. It means “ask my parent”, walking up until it finds an ancestor that has set one. The root’s default is WARNING. So a brand-new logger in a program that never configured anything is effectively at WARNING, which is why log.info(...) in a fresh script produces nothing at all and log.warning(...) produces a bare line on stderr — that bare line comes from the last-resort handler, which exists so that a warning is never silently lost.
Propagation, and seeing everything twice
root = logging.getLogger()                 # a handler here
app  = logging.getLogger("myapp")          # and a handler here
logging.getLogger("myapp.loader").info("loaded 3 files")
One call. From the lab:
--- what the myapp handler wrote ---
MYAPP    | myapp.loader | loaded 3 files
--- what the root handler wrote ---
ROOT     | myapp.loader | loaded 3 files
The record travels up: myapp.loader (no handlers, nothing written), myapp (one handler, one line), root (one handler, one more line). Note that both lines say myapp.loader — the record keeps the name of the logger it was created on, which is what makes the hierarchy useful for filtering.
The usual cause is logging.basicConfig(), which is a convenience function that quietly attaches a handler to the root logger. It also does nothing at all if the root already has one, which is why calling it twice appears to work the first time and be ignored the second.
Two fixes, and they are not equivalent:
logging.getLogger("myapp").propagate = False # fix 1Right for a library that must not have its records escape into an application it knows nothing about — although a library should usually not do even this, and should simply attach no handlers and let the application decide.
# fix 2: attach handlers in exactly ONE placeRight for an application, because the alternative is a tree of loggers each holding an opinion about where its output goes, and no single place to change any of it.
Choosing a level honestly
The question is not “how alarming does this feel”. It is “who is this line for, and what do they do about it?”
| Level | Numeric | Who it is for | What they do |
|---|---|---|---|
| DEBUG | 10 | You, tracing your own code | Read it while hunting something; off in production |
| INFO | 20 | The operator | Confirm normal life: the run started, this many records |
| WARNING | 30 | The operator, later | Notice a pattern. Nobody gets up |
| ERROR | 40 | Somebody on call | Look at it. Work did not happen |
| CRITICAL | 50 | Somebody on call, now | The process is going down |
Concretely, from the lab:
DEBUG    ( 10)  retrieved 128 rows from the cache in one query
INFO     ( 20)  run 4711 started: model=small-encoder data=2026-08-01 seed=7
WARNING  ( 30)  upstream returned 429; retrying in 2s (attempt 2 of 5)
ERROR    ( 40)  could not write the output file; this batch produced nothing
CRITICAL ( 50)  no disk space remains; shutting down
The failure mode to avoid has a name: level inflation. If routine events are logged at WARNING because they felt important while you were writing them, the warnings stop being read, and the one that mattered is invisible in the noise. A level is a promise to the reader about what it costs them to ignore this line. Break that promise often enough and the levels carry no information at all.
The sharpest test for the ERROR/WARNING boundary: did work fail to happen? A retry that succeeded is a WARNING — something surprising occurred and the outcome was still correct. A retry that exhausted its attempts is an ERROR, because a batch produced nothing.
exception(), and what error(str(e)) throws away
Inside an except block, this is what most people write:
except ValueError as error:
    log.error("could not parse batch size: %s", str(error))
and this is what it gives the person on call:
ERROR could not parse batch size: invalid literal for int() with base 10: 'sixty-four'Here is the same failure through log.exception():
ERROR    could not parse batch size
Traceback (most recent call last):
  File "<lab>/examples/02_logging_architecture.py", line 279, in demo_d
    parse_batch_size("sixty-four")
    ~~~~~~~~~~~~~~~~^^^^^^^^^^^^^^
  File "<lab>/examples/02_logging_architecture.py", line 259, in parse_batch_size
    return int(text)
ValueError: invalid literal for int() with base 10: 'sixty-four'
The first version says a value was bad. The second says which line of which function was called with it, and by whom. On a machine you cannot attach a debugger to, that is the difference between a fix and a guess.
log.exception(msg) is exactly log.error(msg, exc_info=True). It reads the exception currently being handled out of the interpreter, so it takes no exception argument, and it must be called inside the except block. Outside one, pass the exception explicitly: log.error("...", exc_info=error).
And str(e) loses the type as well. The example above happens to name int() in its message; plenty of exceptions have empty messages, and str(e) then logs an empty string next to your text, which reads as a bug in your logging rather than a bug in your program.
Lazy formatting, and what it actually saves
log.info("saw %s", n)        # lazy: the template and the argument, separately
log.info(f"saw {n}")         # eager: the string is built before info() is called
The f-string is evaluated before info is called, because that is what an argument is. Measured in the lab, with a class that counts how often something asked for its string form:
1000 suppressed DEBUG calls with %s formatting: 0 renders
1000 suppressed DEBUG calls with an f-string:   1000 renders
So what it saves is exactly this: the cost of rendering arguments for records nobody wanted. On a hot path with expensive reprs — a dataframe, a model object, a large dict — that is essentially the whole cost of the logging call. On a small integer it is nearly nothing, and it would be dishonest to sell it as a performance technique in general.
There is a second reason that applies always, and it is the better one. The unformatted template survives onto the record as record.msg. A structured backend can therefore group every occurrence of "batch complete: %d records" as one event with varying arguments, which is what makes “how often did this happen today?” a query rather than a regular expression. An f-string destroys that grouping by baking the number into the text.
Structured logging, and why a log you cannot parse is a log nobody will query
A free-text log is readable by one person looking at one file. The moment there are ten thousand lines across four machines, the question stops being “read this” and becomes “count the ERRORs from run 4711 grouped by event”. That is a query, and a query needs fields.
Writing a JSON formatter is one subclass with one method:
class JsonFormatter(logging.Formatter):
    def format(self, record):
        payload = {
            "ts": iso_utc(record.created),
            "level": record.levelname,
            "logger": record.name,
            "event": record.getMessage(),
        }
        payload.update(self.static_fields)          # run_id, service, version
        for key, value in vars(record).items():     # everything from extra=
            if key not in STANDARD_KEYS:
                payload[key] = value
        if record.exc_info:
            payload["exc_type"] = record.exc_info[0].__name__
            payload["traceback"] = self.formatException(record.exc_info)
        return json.dumps(payload, default=str)
Real output from the lab:
{"ts": "2026-08-16T12:34:53.430Z", "level": "INFO", "logger": "app.prepare", "event": "batch complete", "run_id": "run-4711", "batch": 1, "kept": 61}Four decisions in there are worth naming.
One object per line. Every log-shipping tool ever written reads a stream of lines; a multi-line JSON document is a parsing problem for the reader.
event is the message, and it should be low-cardinality. "batch complete" groups; "batch 1 complete" does not.
run_id is a static field on the formatter, so it is stamped on every line without any call site remembering to. Anything that must appear everywhere belongs there.
The traceback is its own field, not glued onto the message, so a parser never has to guess where one ends and the other begins.
The timestamp is ISO 8601 in UTC — the same argument Day 91 made for storing dates in SQLite. Fixed-width, most-significant-first, so text order is chronological order, so sort on a log file does the right thing.
And the honest cost: JSON logs are unpleasant to read with your eyes. The standard answer is two handlers — a human formatter on the console and JSON to the file or the collector. Same records, two renderings, because the formatter belongs to the handler.
Never log a secret — and the two ways a filter fails
A filter is the right kind of object for redaction, because a filter may edit the record as it passes:
class RedactingFilter(logging.Filter):
    PLACEHOLDER = "***redacted***"

    def filter(self, record):
        record.msg = self.scrub(record.msg)
        record.args = self._scrub_value(record.args)
        for key, value in list(vars(record).items()):
            if key not in STANDARD_KEYS:
                setattr(record, key, self._scrub_value(value))
        return True
Redact by value, not by key name. Key-name redaction (“hide anything called password”) misses log.info("calling %s", url_with_token), which is how secrets actually escape.
Attached to a handler, it closes four routes at once. From the lab:
{"level": "INFO", "event": "calling upstream with key ***redacted***"}
{"level": "INFO", "event": "hard-coded into the message: ***redacted***"}
{"level": "INFO", "event": "config loaded", "api_key": "***redacted***"}
{"level": "INFO", "event": "headers built", "headers": {"Authorization": "Bearer ***redacted***"}}
Now the two ways it fails, both of which were found by measurement while writing this lesson and both of which are asserted by the lab’s test suite so that a future Python changing them fails the build rather than quietly making this page wrong.
Failure one: a filter on a logger does not protect records from child loggers. Attach the redactor to myapp and log from myapp.loader, and the secret goes straight out. A logger’s filters run only for calls made on that logger object; propagation consults the ancestors’ handlers, not their filters. Since every module does the right thing and calls getLogger(__name__), essentially all of your records are propagated records. Attach redaction to each handler.
Failure two: a secret inside an exception message survives. Measured:
the secret survives inside the traceback field: TrueBecause the traceback is rendered by the formatter, from the exc_info tuple, after every filter has already run. The filter never sees that text. Two fixes: scrub in the formatter as well as in the filter — which works, because by then the traceback is text — or, better, never put a credential in an exception message, which removes it from the exception object rather than from one of its renderings.
The rule underneath both: a redacting filter is a seatbelt, not permission to drive at a wall. Do not log the secret.
dictConfig, and rotation
dictConfig is the configuration form worth learning, because it makes the entire logging setup data:
{
  "version": 1,
  "disable_existing_loggers": False,
  "formatters": {
    "console": {"format": "%(asctime)s %(levelname)-8s %(name)-14s %(message)s"},
    "json":    {"()": "applog.JsonFormatter", "static_fields": {"run_id": run_id}},
  },
  "filters": {"redact": {"()": "applog.RedactingFilter", "secrets": [api_key]}},
  "handlers": {
    "console": {"class": "logging.StreamHandler", "level": "INFO",
                "formatter": "console", "filters": ["redact"],
                "stream": "ext://sys.stdout"},
    "file":    {"class": "logging.handlers.RotatingFileHandler", "level": "DEBUG",
                "formatter": "json", "filters": ["redact"],
                "filename": "app.log", "maxBytes": 900, "backupCount": 3},
  },
  "loggers": {"app": {"level": "DEBUG", "handlers": ["console", "file"],
                      "propagate": False}},
  "root": {"level": "WARNING", "handlers": ["console"]},
}
Because it is a dictionary, it can come from the same TOML file as the rest of your configuration, be kept in version control, be diffed in review, and be swapped per environment without touching a line of Python. "()" names a callable, and every other key becomes a keyword argument to it — which is how a custom formatter or filter gets configured from data.
One trap: disable_existing_loggers defaults to True, which silences every logger that already existed when the call is made, including the ones libraries create at import time. Set it to False unless you specifically want that.
Rotation, from a real run with an absurdly small maxBytes to force it:
maxBytes=900, backupCount=3. After 40 more records:
  app.log         429 bytes, 3 lines
  app.log.1       858 bytes, 6 lines
  app.log.2       858 bytes, 6 lines
  app.log.3       858 bytes, 6 lines
app.log is the live one; when it exceeds maxBytes it becomes app.log.1, the old .1 becomes .2, and the file that would have become .4 is deleted. backupCount is how much history you keep and everything past it is gone for good.
TimedRotatingFileHandler is the same idea keyed on the clock. Rolled over by hand in the lab, because waiting for midnight is impractical:
  files after one rollover: 2
    daily.log                the live file
    daily.log.2026-08-16     rolled, named by date
Size-based rotation bounds your disk; time-based rotation bounds your search, because “the log for Tuesday” is one file. Choose by which question you ask more often.
And now the honest part, which is the same conclusion Day 81 reached about scheduling and Day 84 reached about packaging. For a long-running service, writing your own log files is usually the wrong default. Log to stdout and let whatever already supervises your process collect it. Four reasons:
- In-process rotation is racy across processes. Two workers with
RotatingFileHandleron one file will rename it out from under each other. The documented answer involves aQueueHandlerand a single writing process, and it exists because the simple thing does not work. - The supervisor already does it, uniformly, for every service on the machine, with one retention policy you can audit.
- A container has no persistent disk to rotate onto anyway.
- stdout composes.
your-app | grep ERRORworks. A file handler inside the process composes with nothing.
File rotation is right for a scheduled job on a machine with a disk and no supervisor, for a desktop application, or for a deliberately separate audit trail with its own retention rules. Those are real cases; they are not the default.
The four layers, and provenance
Now the configuration half, built from scratch. The whole design is two dataclasses:
@dataclass(frozen=True)
class Setting:
    name: str
    kind: str                       # "str" | "int" | "bool"
    default: Any
    env: str | None = None
    flag: str | None = None
    choices: tuple[Any, ...] | None = None
    minimum: int | None = None
    secret: bool = False

@dataclass(frozen=True)
class Resolved:
    name: str
    value: Any
    source: str                     # "default" | "file:..." | "env:..." | "flag:..."
    raw: str | None = None
    secret: bool = False
Resolved is the whole idea. A value and its provenance, together, because they are useless apart.
The resolution is one loop with four blocks, each of which overwrites value and source. Give one setting a different value in all four layers at once and add them one at a time — this is the real output:
  nothing but the code      batch_size = 32    from default
  + the config file         batch_size = 64    from file:config.toml
  + the environment         batch_size = 128   from env:APP_BATCH_SIZE
  + the flag                batch_size = 256   from flag:--batch-size
The ordering is not arbitrary, and you should be able to justify it: each layer is more specific than the one below it. A default is what everybody gets. A file is what this deployment gets. A variable is what this process gets. A flag is what this invocation gets, typed by a person looking at the problem right now. The more specific statement wins — the same rule CSS uses and the same rule your shell uses.
And then the payoff, which is one table:
setting       value            came from
------------  ---------------  ------------------------
log_level     'DEBUG'          flag:--log-level
batch_size    256              flag:--batch-size
model_name    'small-encoder'  file:config.toml
seed          7                env:APP_SEED
dry_run       False            file:config.toml
data_version  '2026-08-01'     file:config.toml
api_key       ***redacted***   env:APP_API_KEY
Seven settings, five different provenances, one screen. Without that third column, “why is batch_size 256?” means reading a TOML file, a deployment manifest, a shell wrapper and an argparse definition, in the dark, under pressure.
Note api_key: its source is printed and its value is not. Those are two different questions and only one of them is dangerous. “Is the key set, and did it come from the environment?” is exactly what you need at 03:00.
tomllib, and the type problem
with path.open("rb") as handle:       # BINARY mode. This catches everybody once.
    table = tomllib.load(handle)
tomllib has been in the standard library since 3.11 and is read-only — there is no tomllib.dump. That is a deliberate scope decision and it is fine, because a program almost always reads its configuration and almost never writes it.
The advantage a typed file format has over the environment is concrete: TOML has real types.
from config.toml: batch_size = 64 (int), dry_run = False (bool)No conversion. Whereas everything from the environment is a string, and a string is not a type. The trap, in one line:
bool("false") -> TrueEvery non-empty string is truthy in Python. So the naive conversion turns the word false into on, silently, and the feature you switched off stays switched on. No error, no warning, just the wrong behaviour — which is why this deserves a function with an explicit table of words and a refusal for everything else:
    to_bool('true'  ) -> True
    to_bool('false' ) -> False
    to_bool('maybe' ) -> refused: expected one of ['0', '1', 'false', 'no', 'off', 'on', 'true', 'yes'], got 'maybe'
And a related subtlety with real consequences: a missing environment variable and an empty one are different.
  not set at all             value='small-encoder'    source=file:config.toml
  set to the empty string    value=''                 source=env:APP_MODEL_NAME (set but empty)
  set to a value             value='large-encoder'    source=env:APP_MODEL_NAME
The distinction is made by asking "APP_MODEL_NAME" in environ rather than os.environ.get("APP_MODEL_NAME"). .get returns None for never-set and "" for set-to-empty, and the usual idiom then collapses both:
name = os.environ.get("APP_MODEL_NAME") or "tiny-baseline" # loses the differenceIt matters because an empty variable is almost never an accident. It is a deployment template that filled in nothing, a secret injection that failed, or a person who meant to clear a value. Treating all three as “unset” hides all three.
Validating at startup
A bad configuration value has two possible moments of discovery: the second the process starts, or the first time the code path that uses it runs — which may be hours later, in the middle of the night, halfway through a job. Choose the first.
  3 problems found, all of them at once:
    - log_level: 'VERBOSE' is not one of ['DEBUG', 'INFO', 'WARNING', 'ERROR', 'CRITICAL'] (from flag:--log-level)
    - batch_size: 0 is below the minimum of 1 (from flag:--batch-size)
    - seed: -1 is below the minimum of 0 (from env:APP_SEED)
Two decisions in those messages. They are reported all at once, because fixing configuration one error per run is miserable and pushes people towards guessing. And every one names its provenance: “batch_size must be at least 1” tells you what is wrong; “batch_size: 0 is below the minimum of 1 (from flag:--batch-size)” tells you where to go and change it. The second costs one extra field on a dataclass.
An everyday analogy
An aircraft carries two recorders, and it will not push back from the gate until a checklist has been completed. Those are the two halves of today, on one aeroplane.
The flight data recorder is your structured log. It does not record prose; it records parameters — altitude, heading, engine settings — each stamped with a time and tied to this flight. Nobody reads it during the flight. It exists entirely for the person who will read it afterwards, who was not on board and cannot ask the crew anything. That is precisely the reader a log line has, and it is why a line without a timestamp, a severity and a run identifier is not evidence.
The cockpit voice recorder is your DEBUG stream: everything said, continuously, on a short loop that overwrites itself. Enormously useful, far too voluminous to keep forever, and it is deliberately allowed to be overwritten. That is log rotation, and backupCount is the length of the loop.
The severity of a message is a promise about what happens next. A caution chime is not a warning horn, and a warning horn is not a stick shaker. Crews are trained on the difference and the difference is the entire point. When an aircraft chimed for routine events, crews learned to ignore chimes — the aviation industry has a name for this problem and has spent decades designing it out. That is level inflation, and your log has the same disease when everything is a WARNING.
The pre-flight checklist is startup validation. Nobody wants to discover a bad setting at altitude. The checklist is run on the ground, all of it, and it refuses to proceed if a value is wrong. And crucially it is a challenge and response — the value is read back aloud, so that “who set this and to what?” has an answer. That read-back is your provenance table.
Where the analogy breaks, and it is worth saying because a leaky analogy is worse than none. An aircraft’s recorders are legally mandated, tamper-resistant, and survive a crash; your log file does not, gets rotated away, and vanishes when a container dies. If you need something to survive, write it to a durable store deliberately. A log is evidence in the ordinary sense, not in the legal one.
And redaction has no aviation counterpart at all. There is nothing on an aircraft analogous to a credential that must be recorded nowhere. That part of today is its own thing.
Examples in practice
The whole day in one program
The lab’s 06_run_manifest.py joins both halves. It resolves configuration through four layers, validates it, and then writes the manifest as its first log line — the configuration, plus the provenance of every value, with the secret absent:
{"ts": "2026-08-16T12:37:14.272Z", "level": "INFO", "logger": "run", "event": "run started", "run_id": "run-4711", "config": {"log_level": "INFO", "batch_size": 64, "model_name": "small-encoder", "seed": 7, "dry_run": false, "data_version": "2026-08-01", "api_key": "***redacted***"}, "provenance": {"log_level": "default", "batch_size": "file:config.toml", "model_name": "file:config.toml", "seed": "env:APP_SEED", "dry_run": "file:config.toml", "data_version": "file:config.toml", "api_key": "env:APP_API_KEY"}}
{"ts": "...", "level": "INFO", "logger": "run", "event": "step complete", "run_id": "run-4711", "step": 1, "loss": 1.003238}
{"ts": "...", "level": "INFO", "logger": "run", "event": "step complete", "run_id": "run-4711", "step": 2, "loss": 0.668175}
{"ts": "...", "level": "INFO", "logger": "run", "event": "step complete", "run_id": "run-4711", "step": 3, "loss": 0.506509}
{"ts": "...", "level": "INFO", "logger": "run", "event": "artifact written", "run_id": "run-4711", "artifact": "small-encoder.bin"}
{"ts": "...", "level": "INFO", "logger": "run", "event": "run finished", "run_id": "run-4711", "steps": 3, "final_loss": 0.506509}
And then the command to repeat it, derived from the log rather than from anybody’s memory:
  python3 examples/06_run_manifest.py \
      --seed 7 --batch-size 64 \
      --model-name small-encoder --data-version 2026-08-01
The lab’s test suite runs that second command and asserts the final loss comes out at 0.506509 again. That assertion is the point of the whole day: the log was sufficient.
Note also that the JSON goes to stdout and the human summary goes to stderr. Two streams, two audiences, no interleaving — so program | jq works and a person watching still sees prose.
logging.basicConfig — the convenience, and its two surprises
For a script, one line is genuinely enough:
logging.basicConfig(level=logging.INFO,
                    format="%(asctime)s %(levelname)-8s %(name)s %(message)s")
Two things it does that are worth knowing. It configures the root logger, which is why every module’s getLogger(__name__) suddenly starts producing output. And it does nothing if the root already has a handler, unless you pass force=True — which is why a second call appears to be ignored, and why calling it inside a library is antisocial.
The alternatives, actually used
What follows is what each tool looks like in practice. Only python-dotenv was run here; the rest are described from their documentation, and no output is reproduced for them, because they are not installed on this machine.
structlog is the most-used third-party logging library and its central idea is genuinely different: you bind context to a logger and it travels with every subsequent call.
log = structlog.get_logger().bind(run_id="run-4711")
log = log.bind(batch=3)
log.info("batch complete", kept=61)     # carries run_id and batch automatically
That solves a real problem — threading a request id through forty call sites — which the standard library answers less elegantly with LoggerAdapter or a contextvars-based filter. Free, open source (Apache 2.0 / MIT dual). Choose it when your program has request-scoped or run-scoped context that must appear on every line. It interoperates with the standard library rather than replacing it.
loguru takes the opposite position: one importable logger, no configuration ceremony.
from loguru import logger
logger.add("app.log", rotation="500 MB", retention="10 days", serialize=True)
logger.info("batch complete")
Genuinely pleasant for a script or a personal tool, and the rotation and retention arguments are nicer than anything in the standard library. Free, open source (MIT). The cost is that it is not the standard library’s architecture, so a library that uses loguru imposes loguru on its users — which is exactly the coupling PEP 282 was written to prevent. Applications, yes; libraries, no.
python-json-logger does precisely the forty lines you write in the lab.
handler.setFormatter(jsonlogger.JsonFormatter("%(asctime)s %(levelname)s %(message)s"))Free, open source (BSD). Choose it when you want JSON logs and nothing else changed. Having written the formatter once, you will find nothing surprising in it — which is the argument for writing it once.
pydantic-settings is the configuration answer for anyone already using pydantic, which Day 94 covered:
class Settings(BaseSettings):
    batch_size: int = 32
    api_key: SecretStr
    model_config = SettingsConfigDict(env_prefix="APP_", env_file=".env")

settings = Settings()      # reads env, .env, then defaults; validates; raises on bad input
Free, open source (MIT). It gives you typed coercion, validation with good error messages, nested models, and SecretStr, whose repr deliberately does not show the value — the same instinct as our provenance table’s ***redacted***. Choose it for any service of real size. What it does not give you out of the box is the provenance of each value, which is the one thing this day insists on; you can get close with model_config introspection, but it is not the headline feature.
dynaconf goes furthest: multiple file formats, environments, layered overrides, Vault and Redis integration. Free, open source (MIT). Choose it when you genuinely have many environments and many formats. For a single service it is more machinery than the problem has.
python-dotenv is the small one, and it is the one that happened to be installed on the machine this lesson was written on, so here is a real run of version 1.2.2:
python-dotenv 1.2.2
dotenv_values('.env') -> {'APP_MODEL_NAME': 'large-encoder', 'APP_BATCH_SIZE': '256', 'APP_DRY_RUN': 'false'}
APP_BATCH_SIZE before: None
APP_BATCH_SIZE after:  '256' type: str
APP_DRY_RUN after:     'false' -> bool(): True
load_dotenv() overrides an existing variable? set-by-the-real-environment
with override=True: large-encoder
Read the last three lines carefully, because they are the whole of what this library is.
APP_BATCH_SIZE arrives as the string '256' — python-dotenv puts values into os.environ, and os.environ holds strings, so every type problem in this lesson survives it untouched. And bool('false') is still True. It solves the delivery of values, not their interpretation.
By default load_dotenv() does not override a variable that is already set — the real environment wins, which is the correct precedence and worth knowing, since override=True reverses it and is usually a mistake in a deployed process.
Free, open source (BSD). Choose it for local development, so each developer has a .env that is in .gitignore and never in the repository. Do not use it in production, where the environment is set by the thing that starts your process.
| Tool | Solves | Free? | Ran here? |
|---|---|---|---|
stdlib logging | Everything, verbosely | Yes (PSF) | Yes — everything in this lesson |
structlog | Bound context per logger | Yes (Apache 2.0 / MIT) | No — not installed |
loguru | Zero-ceremony logging for applications | Yes (MIT) | No — not installed |
python-json-logger | JSON formatting, nothing else | Yes (BSD) | No — not installed |
stdlib argparse + os.environ + tomllib | The four layers, by hand | Yes (PSF) | Yes — the lab’s resolver |
pydantic-settings | Typed, validated settings | Yes (MIT) | No — not installed |
python-dotenv | Loading a .env into the environment | Yes (BSD) | Yes — v1.2.2, output above |
dynaconf | Many formats, many environments, secret backends | Yes (MIT) | No — not installed |
Implications: security, privacy, performance, scalability, and cost
Security. A secret in a log line is an incident, and the reason is the copying. Within minutes of anything going wrong, a log excerpt is in a ticket, a chat message, a screenshot, a CI artifact and three people’s scrollback, and every copy has to be found before a rotation is complete. Hence the four rules, in order of value: do not log the secret; do not put a secret in an exception message; redact by value on every handler; and scrub in the formatter too if you can afford it. And on the configuration side: no secret in a file in the repository, ever, because deleting the line does not remove it from the history — and no secret as a command-line flag, because command-line arguments are visible in ps to every other user on the machine and land in the shell history file. That is why the lab’s api_key setting deliberately has no flag.
Privacy. Logs are where personal data leaks by accident rather than by design, because nobody thinks of a log as a data store. log.debug("request: %r", request) will happily record an email address, a home address, a payment token and a search query, and then keep them for ninety days in a system with no access controls and no deletion process. Two habits fix most of it: log identifiers rather than contents (user_id=4711, never email=...), and treat retention as a decision you make once rather than a default you inherit. A field you never log cannot leak.
Performance. Logging is cheap and it is not free. A suppressed record costs one integer comparison — that is the logger’s level check, and it is why lazy formatting matters, because the argument rendering is the expensive part and lazy formatting skips it entirely. An emitted record costs formatting plus a write; StreamHandler writes are I/O and, on a hot path, are the thing to worry about rather than the record construction. If logging is genuinely on your critical path, QueueHandler moves the emitting to another thread. Do not reach for that until you have measured, and remember the ordering rule from Day 89: measure, then optimise.
Scalability. At one machine, a file is fine. At ten, you need the lines to be parseable and to carry enough identity to be reassembled — which is what run_id, the logger name and the ISO 8601 timestamp are for. The transition that hurts is going from free text to structure after you already have terabytes of the former, so choose JSON earlier than feels necessary. Two failure modes at scale are worth knowing about in advance: a log line per item in a large loop will out-cost the work itself, and in-process file rotation across multiple processes is racy — which is the second reason, after the container one, that stdout plus a supervisor wins.
Cost. This is the part people meet unexpectedly. Hosted log platforms charge by ingested volume, so a DEBUG line in a hot loop is a line item on an invoice. The lever is the level, and it is the reason the level has to be configurable without a deployment: turn DEBUG on for ten minutes on one service, then turn it off. Two cheaper habits: sample the high-volume events rather than dropping them entirely, and put the detail in fields rather than in longer messages, since a queryable field is worth more per byte than prose. No prices are quoted here because they change and would be wrong by the time you read this.
And the cost of the alternative, which is the one that never appears on an invoice: the hours spent reconstructing what happened from a log that could not answer, and the decisions made on numbers nobody could reproduce.
Alternatives: free, open source, and commercial
The tools table above covers the libraries with when-to-choose-it, how-to-use-it and free-versus-paid for each, so this section takes the architectural alternatives — the choices you make before you pick a library.
No logging at all — print to stdout. Genuinely correct for a script that runs for four seconds under your supervision and is thrown away. It costs nothing and needs no setup. It stops being correct the moment the program runs anywhere you are not, and the migration cost grows with every call site.
warnings instead of logging. The standard library’s warnings module is for telling a developer that their code will break — a deprecated argument, a risky default. It is not for runtime events. The two are often confused because both produce yellow-ish text; the test is audience. A developer reading their own code at development time, or an operator reading a running system?
Writing your own logger. Everybody does this once. It is forty lines and it works. What you lose is the thing the module’s architecture exists for: a library cannot log through your logger without importing your application, and the moment you depend on a library that uses the standard logging module you have two systems, two formats, and no way to line them up. Write the formatter and the filter yourself — as this lab does — and let the module own the plumbing.
Configuration by import — from settings import BATCH_SIZE. Fast to write, and the objection is not aesthetic: a Python file is executable, so your configuration can now do anything, including things you did not intend when the file came from somewhere unexpected. It also cannot be read by anything that is not Python, which rules out your deployment tooling.
Configuration by JSON or YAML instead of TOML. JSON is universal and has no comments, which for a human-edited configuration file is a genuine loss. YAML is comfortable to write and has a large surface area of surprises — the classic being that unquoted no parses as boolean false in YAML 1.1 — and needs a third-party parser. TOML is in the standard library from 3.11, has comments, has real types, and has no execution semantics. For a config file that humans edit, TOML is the current best default; for machine-to-machine data, JSON.
Environment-only configuration, the strict Twelve-Factor reading. It is a good default and it has limits worth naming, since this lesson cites the document. Environment variables are flat, so nested structure has to be faked with prefixes and underscores. They are all strings, so every type problem in this lesson applies. They are inherited by child processes, which is occasionally a leak. And they are awkward to review, because there is no file to diff. A file for the structured, shared, non-secret values plus the environment for what varies per deployment and for secrets is the arrangement most teams converge on, and it is what the lab builds.
A configuration service — Consul, etcd, a cloud parameter store. Right when configuration must change without a restart, or when many services share values. It buys you dynamic reconfiguration and audit; it costs you a network dependency at startup, a new failure mode, and the question of what your program does when the service is unreachable. Do not take that on for a program that could read a file.
Comparison with related concepts
| Concept | What it is | When it is the right tool | How it differs from today |
|---|---|---|---|
| Logging | Severity-tagged events with text and fields | ”What happened, and in what order?” | The subject of today |
| Metrics | Numbers over time, aggregated | ”How many, how fast, how often?” | Counting log lines is the wrong way to get a rate |
| Tracing | One request’s path across services, as spans | ”Where did the 400ms go?” | Logs are per-process; a trace stitches processes together |
| Audit trail | Durable, complete, immutable record | ”Prove this happened” | Logs are lossy by design and get rotated away |
print | Text to stdout | A four-second script you are watching | No level, no time, no identity, not configurable |
warnings | Developer-facing notices about code | Deprecations, risky defaults | Audience is the developer, not the operator |
| Exceptions | Control flow for failures | Something cannot proceed | An exception changes what happens; a log records it |
| Configuration | Values that vary per deployment | Anything that differs between environments | Resolved once at startup |
| Feature flags | Values that vary per user, at runtime | Gradual rollout, kill switches | Change without a restart; different machinery |
| Secrets management | Credentials, with rotation and audit | Anything that grants access | Never in a file in the repository |
| CLI arguments | Per-invocation input | What this run should do | The top configuration layer, not a separate idea |
Two of those comparisons deserve a sentence more.
Logging against exceptions is the pairing people most often get wrong, in both directions. Catching an exception, logging it, and continuing as though nothing happened is how a program produces confidently wrong output — if the work did not happen, the caller needs to know, and a log line does not tell the caller anything. Conversely, letting every exception propagate and relying on the crash to be informative works fine for a script and badly for a service that is meant to survive one bad record out of a million. The rule that resolves it: log at the level that can decide what to do. Deep in a helper, raise. At the boundary where a decision is possible — the batch loop, the request handler — catch, log.exception(...), and then explicitly choose to skip, retry or abort.
Configuration against CLI arguments is not a real distinction, and treating it as one is the source of a lot of duplicated code. Flags are simply the highest-precedence layer. Building them as a separate system — argparse here, os.environ there, a config file somewhere else, each read at the point of use — is how a program acquires four sources of truth and no way to reconcile them.
When to use it — and when not to
Use full logging when the program runs unattended, when anybody other than you will read its output, when it runs more than once so runs must be distinguishable, when failures need to be diagnosable after the fact, or when the level might need to change without a deployment. Any one of those is sufficient.
print is fine in a script that runs for a few seconds while you watch it, in a teaching example where the machinery would obscure the point, and — importantly — for a program’s actual output. A command-line tool that prints a report should print the report to stdout. The report is not a log line and should not be formatted like one. The lab’s 06_run_manifest.py splits them deliberately: JSON events on stdout, the human summary on stderr.
Use structured JSON logging when the log will be searched by anything other than a human eye, when there is more than one machine, or when you want to count events rather than read them. Use plain text when a person is the only consumer, on their own terminal — and note that these are not exclusive, because two handlers with two formatters give you both from the same records.
Use file rotation for a scheduled job on a machine with a disk and no supervisor, for a desktop application, or for a deliberately separate audit trail. Use stdout for anything supervised, containerised, or multi-process — which is most services.
Use the full four-layer resolver when a program is deployed to more than one environment, when several people run it with different settings, or when reproducing a past run matters, which for anything model-related it always does. Do not build it for a script with two constants at the top of the file; a constant is a perfectly good configuration mechanism for a program with one deployment, and the honest cost of the resolver is roughly two hundred lines you now maintain.
Do not log inside a tight numeric loop without sampling; inside an exception handler that then re-raises, which produces the same failure logged five times as it climbs the stack; personal data you have not decided to retain; or anything you would not want in a screenshot.
Do not configure things that are not deployment-varying. A setting that has had the same value everywhere for two years is not configuration; it is a constant with extra machinery and an extra way to be wrong. Every setting is a small permanent tax: a line in the file, a line in the docs, a value to validate, and one more thing that can differ between two machines for reasons nobody remembers.
Knowledge check
- A logger is set to DEBUG and a debug call produces no output at all, with no error. Name the two most likely causes and the one-line check that distinguishes them.
- One
log.infocall produces two identical lines. What is the mechanism, and what are the two fixes — and which belongs in a library rather than an application? - Why does
log.exception("...")take no exception argument, and what breaks if you call it outside anexceptblock? - What does
log.info("saw %s", n)save overlog.info(f"saw {n}")when the record is emitted rather than suppressed? - A redacting filter is attached to
logging.getLogger("myapp")and the secret still reaches the log frommyapp.loader. Why, and where should the filter go? - Why does a secret inside an exception message survive a redacting filter that scrubs
record.msg,record.argsand theextra=fields? - Put the four configuration layers in precedence order and give the one-sentence justification for that ordering.
APP_DEBUG=falseis set. What doesbool(os.environ["APP_DEBUG"])return, and what should the code do instead?- What is the difference between
APP_MODELbeing unset and being set to the empty string, and which expression tells them apart? - Why must a validation message name the provenance of a bad value and not just the setting?
Hands-on exercise
Work through the lab: labs/sections/programming-with-python/day-097-logging-and-configuration/.
Twelve exercises across two files, plus five demonstration scripts to read afterwards.
cd labs/sections/programming-with-python/day-097-logging-and-configuration

# 1. It should be green before you change anything.
bash tests/run_tests.sh
echo "exit code: $?"

# 2. Read the brief: starter/00_brief.md

# 3. Find out where you stand. It will say 0 of 12, and say why for each one.
bash starter/03_check.sh

# 4. Exercises 1-6 in starter/01_logging.py:
#      1  a module logger from logging.getLogger(__name__)
#      2  convert the print-based function, with the right levels and lazy
#         formatting, returning its result rather than printing it
#      3  a logger and handler that BOTH pass DEBUG
#      4  a failure logged with exception(), traceback attached
#      5  a JSON formatter with ts, level, logger, event and every extra= field
#      6  a redacting filter: message, args, and values nested in a dict

# 5. Exercises 7-12 in starter/02_config.py:
#      7  to_bool, refusing anything ambiguous
#      8  load_toml, in binary mode, tolerating a missing file
#      9  the four layers, in precedence order
#     10  a missing environment variable told apart from an empty one
#     11  provenance recorded for every value
#     12  startup validation naming the setting AND the layer, plus safe_dict

# 6. Then read the reference, in this order:
python3 examples/01_prints.py
python3 examples/02_logging_architecture.py
python3 examples/03_structured_logging.py
python3 examples/04_config_resolver.py
python3 examples/05_dictconfig_and_rotation.py
APP_API_KEY=sk-live-9f2c4a7b1e63 APP_SEED=7 python3 examples/06_run_manifest.py
Expected output
The harness ends with a real captured line and exits 0:
86 checks, 0 failure(s).The starter reports honestly at both ends:
0 of 12 exercises complete.     (exit 1, before you begin)
12 of 12 exercises complete.    (exit 0, for the reference answers)
The two-level trap: three calls, one line.
--- three calls were made; this is what came out ---
WARNING  trap             this warning gets through
Lazy against eager, measured:
1000 suppressed DEBUG calls with %s formatting: 0 renders
1000 suppressed DEBUG calls with an f-string:   1000 renders
The four layers, one setting, four values:
  nothing but the code      batch_size = 32    from default
  + the config file         batch_size = 64    from file:config.toml
  + the environment         batch_size = 128   from env:APP_BATCH_SIZE
  + the flag                batch_size = 256   from flag:--batch-size
Missing against empty, told apart:
  not set at all             value='small-encoder'    source=file:config.toml
  set to the empty string    value=''                 source=env:APP_MODEL_NAME (set but empty)
  set to a value             value='large-encoder'    source=env:APP_MODEL_NAME
Validate your work
bash tests/run_tests.shends with86 checks, 0 failure(s).and exits 0.bash starter/03_check.shreports12 of 12 exercises complete.and exits 0.- Exercise 2’s “preparation done” record still contains a
%placeholder inrecord.msg— the checker asserts this, because an f-string would have baked the number in and destroyed the grouping. - Exercise 3’s logger is at DEBUG and its single handler is at DEBUG, and a debug call reaches the buffer.
- Exercise 4’s record has
exc_infoset and its rendered form contains bothTracebackandValueError;log_parse_failurereturnsFalsefor bad input andTruefor good. - Exercise 5’s lines parse with
json.loadsand carryts,level,logger,event, the staticrun_id, and everyextra=field — withtsending inZ. - Exercise 6 leaves the secret nowhere in the captured output, with the placeholder appearing at least three times: from the message, from the arguments, and from inside a nested dict.
- Exercise 9 resolves
batch_sizeto 32, 64, 128, 256 as the layers are added. - Exercise 12 reports exactly two problems for the bad configuration, each naming its setting and its
flag:source, with no secret in any message, andsafe_dict()["api_key"]is***redacted***. find . -type d -name __pycache__finds nothing, and there is noapp.login the lab directory.
Troubleshooting
Nothing comes out at all. The logger’s level, a handler’s level, an ancestor with propagate = False, a filter returning False, or no handler anywhere. Print all three at once: log.level, [h.level for h in log.handlers], log.propagate.
Everything comes out twice. A handler on your logger and a handler on the root, usually because basicConfig() was called somewhere. Inspect logging.getLogger().handlers.
ValueError: unsupported format character. A literal % in a message that also has %s arguments. Write %%.
Attempt to overwrite 'message' in LogRecord. An extra= key collides with an attribute the record already has. Rename it.
--- Logging error --- on stderr. A formatter or filter of yours raised. The logging module catches it deliberately so that a logging bug cannot take your program down; the traceback under that banner is the real one.
TypeError: File must be opened in binary mode. tomllib.load needs open(path, "rb"). This catches everybody exactly once.
A flag you did not pass overrides your environment variable. You gave argparse a default=, so “not passed” and “passed the default” became indistinguishable. Set every flag’s argparse default to None and do the layering yourself.
The redacting filter appears to do nothing. It is on a logger and the record came from a child, or the secret is inside an exception message. Both are covered above and both are demonstrated in examples/03_structured_logging.py.
Common mistakes
Setting the logger’s level and stopping there. The handler has one too. This is the single most common logging mistake there is.
Calling basicConfig() in a library. It configures the root logger, which belongs to the application. A library attaches no handlers and configures nothing.
Using an f-string in a log call. It costs you the suppressed-record saving and, more importantly, the ability of a structured backend to group occurrences of the same event.
log.error(str(e)). Throws away the traceback and the exception type — the two things that make the difference between a fix and a guess.
Catching, logging, and continuing. If work did not happen, the caller needs to know. A log line informs nobody in the program.
Putting the redacting filter on a logger. It looks like whole-application protection and covers only calls made directly on that logger object.
Putting a secret in a config file or a command-line flag. The first is in your repository forever; the second is in ps and in shell history.
os.environ.get("X") or default. Collapses “never set” and “set to empty” into one answer, and there are situations where you need to tell them apart.
Validating a setting where it is used rather than at startup. That is how a typo in a deployment becomes a 03:00 failure.
Logging a request or response object wholesale. It is the most reliable way to put personal data and credentials into a system with no retention policy.
Practice assignment
Take a program you have already written in this course — Day 84’s automation toolkit is the intended target, and Day 82’s API or Day 90’s database work will do — and give it the two things it is missing.
- Replace every
printwith a logging call at a level you can justify. For each one, write a one-line comment saying who the line is for and what they do about it. If you cannot answer, the line probably should not exist. - Configure logging in exactly one place, with
dictConfig, and give it two handlers: a human formatter on the console at INFO and a JSON formatter at DEBUG going to stdout or a file. Same records, two renderings. - Add a run id stamped by the formatter onto every line as a static field. Take it from configuration with a default.
- Resolve every constant in the program through the four layers, using the lab’s
appconfig.pyor your own. Every value must report its provenance. - Validate at startup. Every constraint you can state — a range, a set of choices, a path that must exist — checked before any work begins, with messages that name the setting and its layer.
- Log the manifest as the first event, and prove it is enough: run the program, take only its log, reconstruct the command, run it again, and compare the outputs.
Deliverables: the modified program, the dictConfig dictionary, one captured log from a successful run, one from a run that failed configuration validation, and a short note on the two logging calls whose level you found hardest to choose and why you settled where you did.
The bar to hit: somebody who has never seen the program should be able to say what it was configured with, and why each value was what it was, from the log alone.
Extension challenge
Pick one. Each is a genuinely open question rather than an exercise with an answer at the back.
1. Close the traceback hole properly. The lesson shows a formatter that scrubs its finished line. That works and it is a rendering-level fix. Design a source-level one: a lint rule, a custom exception base class, or a wrapper that raises credential-free exceptions. Then measure the cost of each approach on a real codebase and write down which you would actually adopt and why.
2. Add context propagation without structlog. Use contextvars and a filter to attach a request id or run id to every record emitted anywhere in a call tree, including from libraries you do not control. Get it right under asyncio — Day 96’s material — and then explain in a paragraph what structlog’s bind is doing that your version is not.
3. Make configuration reloadable, and find out what breaks. Add a signal handler that re-resolves configuration and applies the new log level. Then enumerate honestly which settings cannot safely change at runtime — a database path already opened, a thread pool already sized — and design the mechanism that stops somebody changing them. The interesting part is the list, not the code.
4. Cost the log. Instrument one of your programs to count log lines by level and estimate bytes per run. Then work out what a hundred instances would produce per day, and which single event accounts for most of it. Propose a sampling strategy for that event and state what you lose by sampling it.
5. Multi-process rotation, done properly. Build the QueueHandler plus single-listener arrangement the standard library documents, for two worker processes writing one rotating log. Then write down what you bought, what you added — a queue, a listener, a new way to lose records at shutdown — and whether you would use it in preference to stdout and a supervisor.
The AI thread
A training run you cannot reconstruct is an anecdote, not a result.
That sentence sounds like a slogan until you have lived it, and everybody who works with models lives it eventually. The number was good. It was better than the number from three weeks ago. Somebody asks which change produced it — the new data snapshot, the learning-rate change, the different seed, the base model that was silently updated upstream — and the honest answer is that nobody knows, because nothing recorded it. The run happened. There is no evidence of what it was.
Every one of those things is configuration in exactly the sense this lesson means: a value that varies between runs of the same code. The hyperparameters are configuration. The data version is configuration. The seed is configuration — and a run that does not state its seed cannot be repeated even by the person who ran it. The prompt template is configuration. The model name is configuration, and it is the sneakiest one, because a hosted model behind a stable name can change underneath you, so “which model?” is really “which model, on which date?”, which is why the run’s timestamp is part of its identity too.
And the run log is the only evidence that survives. Not the notebook, which has been re-executed twice since. Not the terminal, which has been closed. Not memory, which is generous about what it remembers. The log — which is why the manifest goes in as the first line, with the provenance of every value, before any work begins.
This is also the honest reason to care about the boring parts of today. The run_id on every line is what lets you separate two runs in one file. The ISO 8601 UTC timestamp is what lets you order events across machines. The JSON shape is what lets you ask “what was the loss at step 400 in every run that used seed 7?” rather than reading. The level is what lets you turn DEBUG on for one run and off for the next thousand without redeploying. None of it is exciting and all of it is what makes an experiment an experiment rather than an occurrence.
The security half lands harder here than almost anywhere else. AI code is unusually full of credentials — provider keys, dataset tokens, registry passwords — and it is unusually full of hastily written scripts that print things while somebody debugs an integration at eleven at night. print(f"calling {url_with_token}") is one line, and it is how keys end up in notebook outputs that get committed, in CI logs that are public, and in screenshots pasted into chat. An API key in a log line is a real incident, with a rotation and a disclosure conversation, and the reason to build the redacting filter today is that the failure it prevents costs far more than the seatbelt does.
And there is a version of all this you will meet again on Day 98 and beyond, under a different name. Experiment trackers exist. They are useful. What they are, underneath, is exactly what you built today: a configuration manifest and a structured run log, given a web page. Having written the small version by hand, you will know what the tool is doing for you, what it is not doing, and — when it inevitably cannot answer a question you need answered — where the answer would have to come from.
Quiz
Q1. You set `logging.getLogger("job").setLevel(logging.DEBUG)`, add one StreamHandler, and call `log.debug("here")`. Nothing appears, and no error is raised. What is the most likely cause?
- The handler's own level is higher than DEBUG, and a record must pass the logger's level AND each handler's level
- DEBUG messages are always suppressed outside a debugger
- The logger name "job" is not registered, so the call was a no-op
- setLevel only takes effect after the first WARNING has been emitted
Show answer
Answer: A. The handler's own level is higher than DEBUG, and a record must pass the logger's level AND each handler's level
This is the two-level trap, and it is the most common logging question there is. A record is gated twice by two different objects. The logger's level decides whether a LogRecord is created at all — that is the cheap exit, and it is why lazy formatting saves anything. Each handler then applies its own level independently, which is exactly what makes it possible to send DEBUG to a file while the console stays at INFO. Setting only the logger's level leaves the second gate wherever it happened to be. Nothing errors, because a logging call that raised would take your program down at the worst possible moment, so silence is the design rather than the bug. The three-line diagnostic is worth memorising: print `log.level`, `[h.level for h in log.handlers]` and `log.propagate` together. Option 3 gets the model backwards — `getLogger` creates the logger on first use and returns the same object every time afterwards, from a module-level registry, which is what makes configuring "myapp" configure "myapp.loader" too.
Q2. A single `logging.getLogger("myapp.loader").info("loaded")` call produces two identical lines. There is one handler on `myapp` and one on the root logger. What is happening?
- getLogger returned two different logger objects for the same name
- The record propagates up the dotted hierarchy and every handler it passes emits it, so two handlers means two lines
- INFO records are emitted twice by design, once for the console and once for the file
- The formatter is being applied twice, producing a duplicate of the rendered text
Show answer
Answer: B. The record propagates up the dotted hierarchy and every handler it passes emits it, so two handlers means two lines
A record travels up the hierarchy — myapp.loader, then myapp, then root — and every handler on the way emits it. That is not a bug; it is the price of the design that lets an application catch a library's records at the root without knowing which libraries exist. The usual cause of the surprise is `logging.basicConfig()`, which quietly attaches a handler to the root logger, so adding one of your own gives you two. Two things about the walk upwards catch people: the ancestors' LEVELS are not re-checked, and the ancestors' FILTERS are not applied at all. Both lines still carry the name `myapp.loader`, because the record keeps the name of the logger it was created on. There are two fixes and they are not equivalent. `propagate = False` is right for a library whose records must not escape into an application it knows nothing about. Attaching handlers in exactly one place is right for an application, because the alternative is a tree of loggers each with an opinion about where its output goes and no single place to change any of it.
Q3. Inside an `except ValueError as error:` block, what does `log.exception("could not parse")` give you that `log.error("could not parse: %s", str(error))` does not?
- A higher severity level, since exception() logs at CRITICAL
- Automatic retry of the failed operation
- The full traceback and the exception type — which line of which function was called with what, and by whom
- Nothing; they are aliases for each other
Show answer
Answer: C. The full traceback and the exception type — which line of which function was called with what, and by whom
`log.exception(msg)` is exactly `log.error(msg, exc_info=True)` — same ERROR level, so option 0 is wrong — and it reads the exception currently being handled out of the interpreter, which is why it takes no exception argument and why it must be called inside the except block. What it adds is the traceback, and the traceback is the whole value: on a machine you cannot attach a debugger to, "which line of which function, called by whom" is the difference between a fix and a guess. `str(e)` also silently discards the exception TYPE. The lesson's example happens to have an informative message, but plenty of exceptions have empty ones, and `str(e)` then logs an empty string next to your text, which reads as a bug in your logging rather than in your program. Outside an except block, pass it explicitly with `exc_info=error`.
Q4. What does `log.debug("summary: %s", expensive_object)` save over `log.debug(f"summary: {expensive_object}")` when the DEBUG level is suppressed?
- Nothing measurable; the two forms compile to the same bytecode
- The cost of rendering the argument — the lab measures 0 renders against 1000 for a thousand suppressed calls
- The cost of opening the log file, which the f-string version forces
- Disk space, because the f-string version writes the line anyway
Show answer
Answer: B. The cost of rendering the argument — the lab measures 0 renders against 1000 for a thousand suppressed calls
The f-string is evaluated before `debug` is even called, because that is what an argument is: Python builds the string, calling the object's __str__, and hands the finished text to a function that then throws it away. The percent-s form hands logging the template and the object separately, and logging joins them only if a handler is actually going to emit the record. The lab counts this with a class that increments a counter in __str__: a thousand suppressed calls render the argument zero times with percent-s and a thousand times with an f-string. Be honest about the size of the win — on a small integer it is nearly nothing, and selling lazy formatting as a general performance technique is overstating it. The reason to use it everywhere is the second one, which applies even when the record IS emitted: the unformatted template survives onto the record as `record.msg`, so a structured backend can group every occurrence of "batch complete: %d records" as one event with varying arguments. An f-string bakes the number into the text and destroys that grouping.
Q5. You attach a RedactingFilter to `logging.getLogger("myapp")`. A module does `logging.getLogger(__name__)` — resolving to `myapp.loader` — and logs the API key. The key appears in the output. Why?
- Filters only run on records whose level is WARNING or above
- The filter must be registered with logging.config.dictConfig before it takes effect anywhere
- The key was cached by the formatter from an earlier call
- A logger's filters run only for calls made on that logger object; a record propagating up from a descendant skips every ancestor's filters
Show answer
Answer: D. A logger's filters run only for calls made on that logger object; a record propagating up from a descendant skips every ancestor's filters
This was measured while the lesson was written, and the lab asserts it so that a future change in Python fails the build rather than quietly making the lesson wrong. Propagation walks the ancestors' HANDLERS; it does not run the ancestors' FILTERS. So a filter on the top-level logger protects only calls made directly on that logger — and since every well-behaved module calls getLogger(__name__) and is therefore a descendant, essentially every record in a real application is a propagated one. The arrangement looks like whole-application protection and is close to none. Attach redaction to each HANDLER instead: a handler sees everything that reaches its destination, from anywhere in the tree. In dictConfig that is a "filters" entry on each handler rather than on the logger. And note the second hole the lab measures: a secret inside an exception MESSAGE survives even a correctly placed filter, because the traceback is rendered by the formatter after every filter has already run.
Q6. Put the four configuration layers in order from lowest precedence to highest, and give the reason for that ordering.
- Command-line flag, environment, config file, default — because the default is the most carefully considered value
- Config file, default, command-line flag, environment — because the environment is set last, at run time
- Default, config file, environment, command-line flag — because each layer is more specific than the one below it
- Environment, config file, command-line flag, default — because a default should never be overridden silently
Show answer
Answer: C. Default, config file, environment, command-line flag — because each layer is more specific than the one below it
Default, then config file, then environment, then command-line flag. The justification is specificity, and it is worth being able to state rather than merely remember: a default is what everybody gets; a file is what this deployment gets; an environment variable is what this process gets; a flag is what THIS INVOCATION gets, typed by a person who is looking at the problem right now. The more specific statement wins — the same rule CSS uses and the same rule your shell uses. The lab makes it concrete by giving one setting a different value in all four layers at once and adding them one at a time: batch_size resolves to 32, then 64, then 128, then 256. Note the practical trap in implementing this: argparse must be given no `default=` of its own, or "not passed" and "passed the default" become the same value and the resolver can no longer tell whether the top layer said anything at all.
Q7. `APP_DRY_RUN=false` is set in the environment. Your code does `dry_run = bool(os.environ.get("APP_DRY_RUN"))`. What happens, and what should the code do?
- dry_run becomes True, because every non-empty string is truthy; use an explicit table of words and refuse anything ambiguous
- dry_run becomes False, because Python parses the word "false" specially
- A ValueError is raised, so the mistake is caught immediately
- dry_run becomes None, because bool() cannot convert a string
Show answer
Answer: A. dry_run becomes True, because every non-empty string is truthy; use an explicit table of words and refuse anything ambiguous
bool("false") is True. Every non-empty string is truthy in Python, so the naive conversion turns the word false into on — silently, with no error and no warning, and the feature you switched off stays switched on. It is the single most expensive one-line bug in configuration handling, and its whole danger is the silence. The fix is a function with an explicit table: {"1", "true", "yes", "on"} is True, {"0", "false", "no", "off"} is False, case-insensitively and ignoring surrounding whitespace, and ANYTHING else raises rather than guessing — including "", "maybe" and "2". This is also the concrete advantage a typed config file has over the environment: TOML has real types, so `dry_run = false` in the file arrives as a Python bool with no conversion at all. Everything from the environment is a string, because that is what the operating system stores, and a string is not a type.
Q8. A validation message reads "batch_size: 0 is below the minimum of 1". What is it missing, and why does that matter?
- The current time, so you know when the failure happened
- The provenance — which of the four layers supplied the 0 — because otherwise you have four places to search
- The stack trace of the validation call
- Nothing; it already names the setting and the constraint
Show answer
Answer: B. The provenance — which of the four layers supplied the 0 — because otherwise you have four places to search
The message correctly names the setting and the constraint, so it tells you WHAT is wrong. What it does not tell you is WHERE to go and change it, and that is the expensive half: the 0 could have come from a default in the code, a TOML file, an environment variable set by a deployment manifest, or a flag in a shell wrapper. "batch_size: 0 is below the minimum of 1 (from flag:--batch-size)" costs one extra field on a dataclass and removes the search entirely. That is the same argument the provenance table makes: the failure that costs the most time in practice is not "the value is wrong", which you notice quickly, but "the value is not what I set it to, and I have four places to look". Two other decisions belong in the same validator: report every problem at once rather than one per run, because fixing configuration one error at a time pushes people towards guessing; and never put a secret's VALUE in a message — name the setting, say ***redacted***, and still print where it came from, because "is the key set, and did it come from the environment?" is a safe question and "what is the key?" is not.
Glossary
- Logger
- The object you call. It has a dotted name, so myapp.loader is a child of myapp which is a child of the root, and configuring an ancestor configures everything beneath it. It has a level, which is the FIRST of two gates a record must pass. Always obtained with logging.getLogger(name), never constructed: getLogger returns the same object for the same name from a module-level registry, which is what makes the hierarchy work at all.
- Handler
- A destination — standard output, a file, a rotating file, a syslog socket, a queue. A logger may have several, and each carries its OWN level, its own filters and its own formatter. That independence is the point: the same call can be dropped by one handler, written as prose by a second and written as JSON by a third.
- Formatter
- The object that turns a LogRecord into text. It belongs to a handler rather than to a logger, which is why the same records can appear as a friendly console line and as a JSON object at the same moment with no change to any call site. It is also where the traceback is rendered — after every filter has already run, which is why a secret inside an exception message survives redaction.
- Filter
- An object with one method that returns True to keep a record and False to drop it, and which is explicitly allowed to EDIT the record on the way through. That permission is what makes redaction possible. Filters can be attached to loggers and to handlers, and the two are not equivalent: a logger's filters run only for calls made on that logger object.
- LogRecord
- The object created when a call passes the logger's level: the unformatted template, the arguments, the level, the logger's name, the creation time, the file and line, the exception information, and anything supplied through extra=. Note what it is not — it is not a string yet. Nothing has been formatted.
- Log level
- A severity, both a name and a number: DEBUG 10, INFO 20, WARNING 30, ERROR 40, CRITICAL 50, with NOTSET at 0 meaning "ask my parent". The numbers rise in tens so a custom level can be inserted between two of them. Note that syslog, where the idea comes from, numbers them the other way round: there a lower number is more severe.
- The two-level rule
- A record must pass the LOGGER's level and then EACH HANDLER's level, and they belong to two different objects. A logger at DEBUG whose handler is at WARNING emits no debug output and raises no error. This is the single most common logging question there is, and the silence is deliberate: a logging call that raised would take the program down at the worst possible moment.
- Propagation
- The record's journey up the dotted hierarchy after the logger it was created on has handled it — myapp.loader, then myapp, then root — with every handler it passes emitting it. Two things surprise people: the ancestors' levels are not re-checked, and the ancestors' filters are not applied at all. It is why one call can produce two lines, and it is also the mechanism that lets an application collect a library's records without knowing the library exists.
- Level inflation
- The failure mode where routine events are logged at WARNING because they felt important while being written, until the warnings stop being read and the one that mattered is invisible. A level is a promise to the reader about what it costs them to ignore the line; break it often enough and the levels carry no information at all.
- Lazy formatting
- Passing the template and the arguments separately — log.info("saw %s", n) — so that the joining happens inside the handler only if a record will actually be emitted. Measured here: a thousand suppressed DEBUG calls render the argument zero times this way and a thousand times with an f-string. The second and better reason applies even when the record IS emitted — the unformatted template survives as record.msg, so a structured backend can group every occurrence of one event.
- Structured logging
- Emitting each event as a machine-parseable object with named fields — usually one JSON object per line — rather than as a sentence. It turns "read the log" into "query the log", which is the only thing that scales past one file on one machine. The honest cost is that JSON is unpleasant to read with your eyes, which is why the usual arrangement is JSON to the collector and a human formatter on the console: the same records, two handlers, two formatters.
- Run identifier
- A value unique to one execution — a scheduler job id, a CI run number, a uuid4 — stamped onto every line so that two runs of the same program in one file are separable. It belongs on the formatter as a static field rather than at every call site, because a value that must appear everywhere should be attached once.
- Log rotation
- Bounding a log file so it cannot fill the disk. RotatingFileHandler renames by size — app.log becomes app.log.1, .1 becomes .2, and the file that would have become .4 is DELETED, because backupCount is how much history you keep. TimedRotatingFileHandler does the same on the clock, naming the rolled file by date. Size-based rotation bounds your disk; time-based rotation bounds your search.
- dictConfig
- Configuring the whole logging system from one dictionary — formatters, filters, handlers, loggers and the root — rather than from a sequence of calls. Because it is data, it can be loaded from the same TOML file as the rest of your configuration, kept in version control and diffed in review. Its trap is disable_existing_loggers, which defaults to True and silences every logger that already existed, including those libraries create at import time.
- basicConfig
- The one-line convenience that quietly attaches a handler to the ROOT logger. Two behaviours worth knowing: it is why every module's getLogger(__name__) suddenly produces output, and it does nothing at all if the root already has a handler unless you pass force=True — which is why a second call appears to be ignored, and why a library must never call it.
- Redacting filter
- A filter that replaces known secret VALUES wherever they appear — in the message, in the arguments, in a field passed through extra=, in a value nested inside a dict. Redaction by value rather than by key name, because key-name redaction misses log.info("calling %s", url_with_token), which is how secrets actually escape. It belongs on each HANDLER, and it is a seatbelt rather than permission to log the secret.
- Configuration precedence
- The order in which layers override one another: default, then config file, then environment, then command-line flag. The justification is specificity — a default is what everybody gets, a file is what this deployment gets, a variable is what this process gets, a flag is what this invocation gets, typed by a person looking at the problem right now.
- Provenance
- The record of WHICH layer supplied a value, carried alongside the value itself and printable as a table. It exists because the expensive failure is not "the value is wrong", which you notice quickly, but "the value is not what I set it to and I have four places to look". It also makes a validation message actionable: "batch_size: 0 is below the minimum of 1 (from flag:--batch-size)" names the fault and the one place to fix it.
- Environment variable
- A key and a string value held by the operating system for a process and inherited by its children. The Twelve-Factor App argues configuration belongs here because it is set outside the code, per deployment, and is never committed. Its limits are equally real: the values are flat, so nesting has to be faked with prefixes; they are all strings, so every type problem applies; and there is no file to diff in review.
- The empty-string distinction
- A variable that was never set and one that was set to "" are different states, and os.environ.get collapses them — None and "" both fall to the default under the usual `or default` idiom. Ask `"NAME" in environ` instead. It matters because an empty variable is almost never an accident: it is a deployment template that filled in nothing, a secret injection that failed, or somebody who meant to clear a value.
- tomllib
- The standard library's TOML reader, added in Python 3.11 and deliberately READ-ONLY — there is no tomllib.dump. Its load function requires a BINARY file object, which catches everybody exactly once. Its advantage over the environment is that TOML has real types, so batch_size = 64 arrives as an int and dry_run = false arrives as a bool, with no conversion and no chance of believing that the string "false" is true.
- Startup validation
- Checking every configuration value before any work begins, so that a bad value fails when somebody deployed it rather than at 03:00 when the code path is finally reached. Two design decisions go with it: report every problem at once, because fixing configuration one error per run pushes people towards guessing; and name the provenance in each message, because that is what turns "what is wrong" into "where to fix it".
- Secret
- A value that grants access — an API key, a token, a password. It belongs in the environment or a secret manager, never in a file in the repository, where deleting the line does not remove it from the history, and never as a command-line flag, where it is visible in `ps` to every other user and lands in the shell history file. Its presence and its provenance may be printed; its value may not.
- Run manifest
- The first line of a run's log: the resolved configuration and the provenance of every value, with secrets replaced by a placeholder. It is what makes a run reproducible from its own record rather than from anybody's memory, and it is the difference between a result and an anecdote — the seed, the data version, the model name and the hyperparameters are all configuration, and nothing else records them.
Sources and further reading
- logging — Logging facility for Python — Python Software Foundation (accessed 2026-08-16)
- Logging HOWTO — Python Software Foundation (accessed 2026-08-16)
- logging.config — Logging configuration — Python Software Foundation (accessed 2026-08-16)
- RFC 5424 — The Syslog Protocol — Internet Engineering Task Force (accessed 2026-08-16)
- The Twelve-Factor App — Adam Wiggins (accessed 2026-08-16)
- typing — Support for type hints — Python Software Foundation (accessed 2026-08-16)
Kept in this browser, no account needed. Your progress page turns the whole record into one link you can bookmark or open on another device.