Deployment, MLOps, and Security › Operating AI in Production › Day 339
Day 339: Monitoring and Alerting
Master production AI observability: implement OpenTelemetry instrumentation, Prometheus metrics scrapers, SRE Four Golden Signals, Grafana dashboards, and automated P95 latency alerts in Python.
Hands-on lab for this lesson
Lab files on GitHub: https://github.com/ai-roadmap-365/ai-roadmap-365.github.io/tree/main/labs/sections/deployment-mlops-and-security/day-339-monitoring-and-alerting
- Get the hands-on files. Clone the labs repository once (you can reuse this clone for every lesson). This works on macOS, Linux, and Windows (PowerShell or WSL):
git clone https://github.com/ai-roadmap-365/ai-roadmap-365.github.io.git cd ai-roadmap-365.github.io - Open this lesson's lab. Move into the directory for this specific day. Every lab lives at the same predictable path — section / subsection / week / day:
cd labs/sections/deployment-mlops-and-security/day-339-monitoring-and-alerting - Read the lab guide. Open `README.md` in that directory. It lists the exact commands, what each does, the expected output, and how to check your work — read it before running anything.
- Run it and check your work. Follow the README's "How to run" section: run the example first to see the finished result, then complete the numbered exercises in `starter/`, then run the tests. The tests pass (exit 0) only when your work is correct.
bash tests/run_tests.sh # or the test command named in the lab README
You can also open the lab as a local page (works offline, shows the file tree and expected output).
Learning objectives
By the end of this lesson you will be able to:
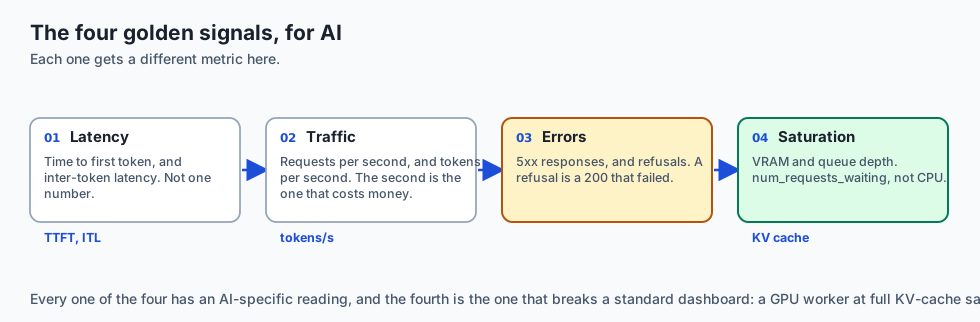
- Deconstruct the SRE Four Golden Signals (Latency, Traffic, Errors, Saturation) adapted specifically for GenAI inference workloads.
- Implement OpenTelemetry custom metrics tracking Time-to-First-Token (TTFT), Inter-Token Latency (ITL), and prompt/completion token consumption.
- Configure Prometheus alerting rules with P95/P99 latency thresholds, error budget burn rates, and PagerDuty escalations.
- Build a production-grade AI Observability & Alerting Engine in Python calculating moving-window percentiles and triggering alert state machines.
- Evaluate anomaly detection on inference metrics: distinguishing transient network jitter from critical GPU driver degradation.
Prerequisites
Why this matters
Operating Large Language Models and AI systems in production without robust observability is like flying a jet aircraft through dense fog with broken instruments:
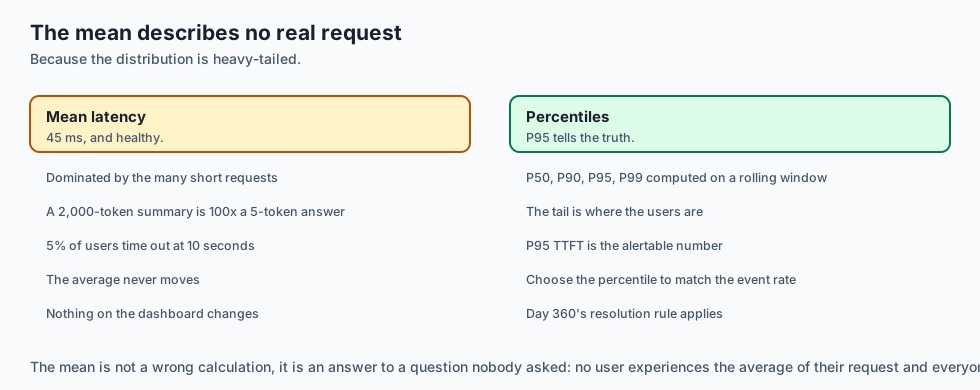
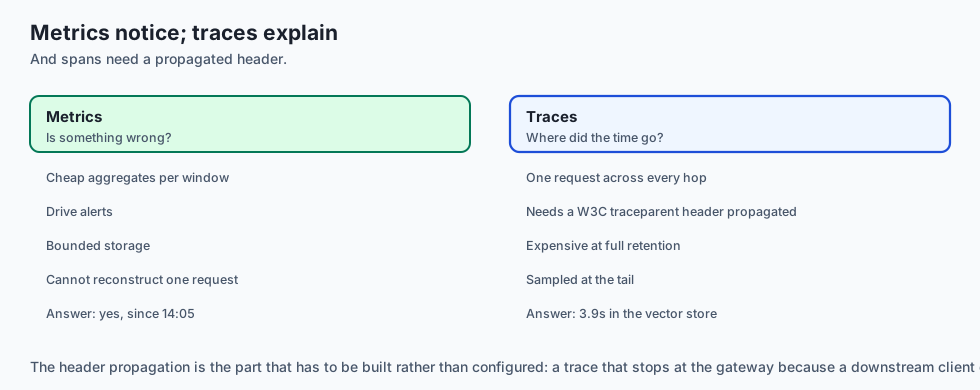
- Deceptive Averages: A model serving endpoint might report a healthy average latency of 45ms, while 5% of users (P95) are silently experiencing 10-second request timeouts due to queue backlogs.
- Silent Degradation: Model drift, hallucination spikes, or unexpected API rate limits degrade customer trust long before traditional server crash alerts trigger.
- Alert Fatigue: Sending noisy, non-actionable email notifications whenever CPU blips to 80% causes engineering teams to ignore real production outages.
Implementing SRE Golden Signals (Latency, Traffic, Errors, Saturation), OpenTelemetry standardized metrics, Prometheus PromQL percentiles, and actionable PagerDuty alert rules ensures 99.99% availability and proactive incident resolution.
The idea in plain language
Think of AI monitoring and alerting like the intensive care monitoring system in a modern hospital:
- The Wrong Metric (Body Weight / Mean CPU): Checking the patient’s weight once a week tells you nothing about a sudden heart attack (Useless Average Metric).
- The Golden Signals (ECG, Blood Pressure, Pulse Oximeter): Continuous real-time sensors track heart rate, oxygen levels, and blood pressure at every second (P95 TTFT, Inter-Token Latency, and GPU KV Cache Saturation).
- Actionable Alarms (The Code Blue Siren): The system does not sound a deafening siren if the patient sneezes. It sounds an emergency alarm (PagerDuty Alert) only when vitals drop into critical danger, immediately summoning the on-call medical team (Rapid Incident Response).
Historical background
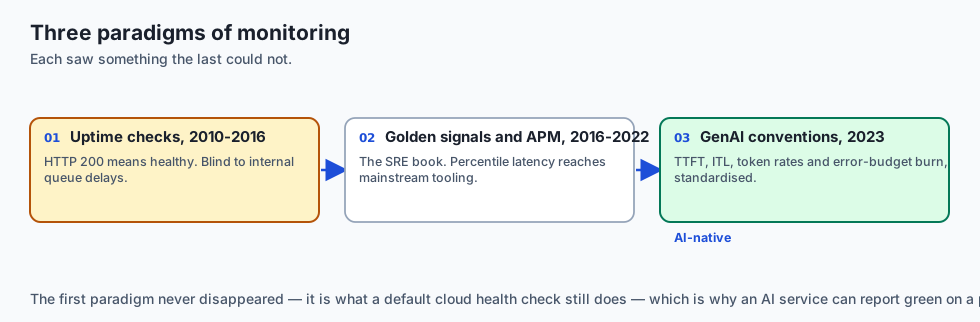
Application monitoring evolved across three major paradigms:
1. Basic Server Uptime & Ping Checks (2010–2016)
Engineers configured simple HTTP health checks. If the server returned HTTP 200, the system was considered healthy, completely blind to internal queue delays.
2. SRE Golden Signals & APM (2016–2022)
Google published the SRE Book, establishing the Four Golden Signals. Tools like Datadog, Prometheus, and Grafana brought percentile-based latency tracking into mainstream engineering.
3. OpenTelemetry & GenAI Native Observability (2023–Present)
The OpenInference and OpenTelemetry GenAI semantic conventions standardized metrics specifically for LLM serving: Time-to-First-Token, Inter-Token Latency, token consumption rates, and error budget burn velocity.
What it is — and what it is not
Let us define the core architecture of production AI monitoring:
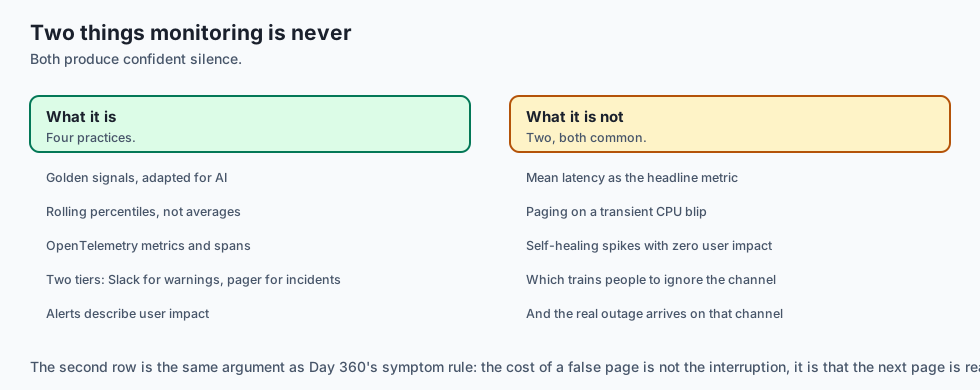
What AI Monitoring Is:
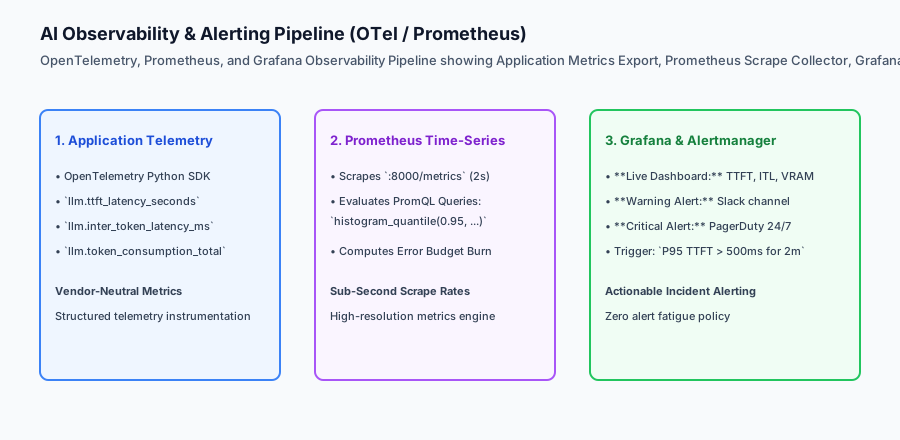
- Tracking the SRE Four Golden Signals adapted for AI: Latency (TTFT & ITL), Traffic (RPS & Tokens/s), Errors (5xx & refusals), Saturation (VRAM & Queue).
- Computing rolling percentiles (P50, P90, P95, P99) to accurately capture heavy-tailed response latency.
- Instrumenting code with standardized OpenTelemetry metrics and distributed span attributes.
- Configuring multi-tier alerting: informational warnings to Slack, urgent actionable incidents to PagerDuty.
What AI Monitoring Is Not:
- Relying exclusively on mean (average) latency metrics.
- Paging on-call engineers for transient, self-healing CPU spikes that have zero impact on user latency.
+-------------------------------------------------------------------------------+
|                    AI SERVING OBSERVABILITY METRICS MATRIX                    |
+-------------------+-----------------------+-------------------+---------------+
| Metric Name       | Measurement Unit      | Target Threshold  | SRE Signal    |
+-------------------+-----------------------+-------------------+---------------+
| Time-to-First-Tok | Milliseconds (ms)     | P95 < 250 ms      | Latency       |
| (TTFT)            |                       |                   | (Prefill)     |
| Inter-Token Lat   | Milliseconds / Token  | P95 < 20 ms/tok   | Latency       |
| (ITL)             |                       |                   | (Decode)      |
| Token Throughput  | Tokens per Second     | Monitored for     | Traffic       |
|                   |                       | capacity planning |               |
| Inference Errors  | Percentage (%)        | Error Rate < 0.1% | Errors        |
| KV Cache Waiting  | Queue Depth Count     | 0 Requests Waiting| Saturation    |
+-------------------+-----------------------+-------------------+---------------+
Why it was created and what problems it solves
Production monitoring resolves the three primary blind spots of AI systems:
1. Catching Heavy-Tailed Latency Spikes
Because generating a 2,000-token summary takes 100x longer than generating a 5-token answer, percentile metrics (P95, P99) isolate tail-latency congestion that average metrics completely miss.
2. Proactive Error Budget Burn Alerting
Multi-window error budget burn alerting notifies teams hours before an availability contract is breached, allowing graceful traffic shedding or rollback.
3. Elimination of Alert Fatigue
Classifying alerts strictly by business impact ensures on-call engineers only receive pages for actionable emergencies requiring human intervention.
How it works
Let us inspect the complete Percentile Latency and Error Budget Tracking Architecture:
[User Inference Request Flow]
              │
              ▼
[OpenTelemetry Instrumentation Interceptor]
  - Records request start timestamp: `t0`
  - Emits first token timestamp: `t1` ➔ Computes `TTFT = t1 - t0`
  - Emits stream completion: `t_end` ➔ Computes `ITL = (t_end - t1) / total_tokens`
              │
              ▼
[Prometheus Metric Collector (:8000/metrics)]
  - Updates sliding-window histogram: `llm_ttft_seconds_bucket`
  - Updates counter: `llm_tokens_total{type="completion"}`
              │
              ▼
[Prometheus Alert Rule Evaluation]
  - Query: `histogram_quantile(0.95, sum(rate(llm_ttft_seconds_bucket[5m])) by (le)) > 0.50`
  - Condition: Has P95 exceeded 500ms continuously for 2 minutes?
              │
              ├── YES ➔ PagerDuty API triggers on-call mobile page
              │        Incident auto-created with runbook link
              │
              └── NO  ➔ Normal steady-state dashboard update in Grafana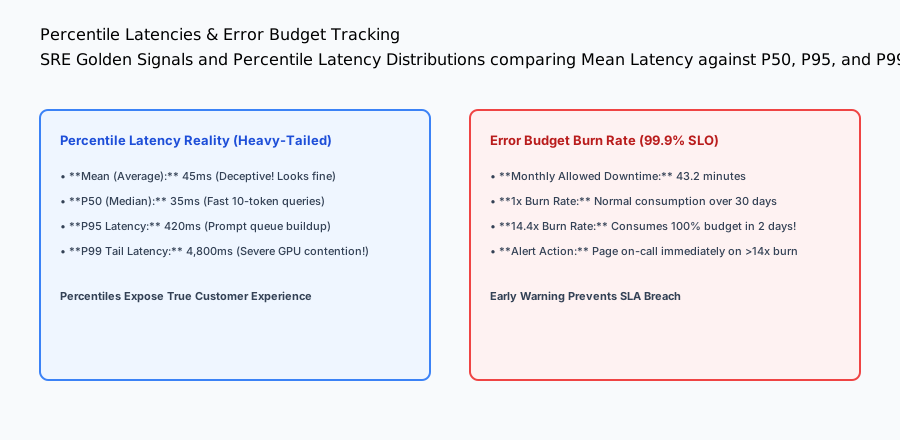
An everyday analogy
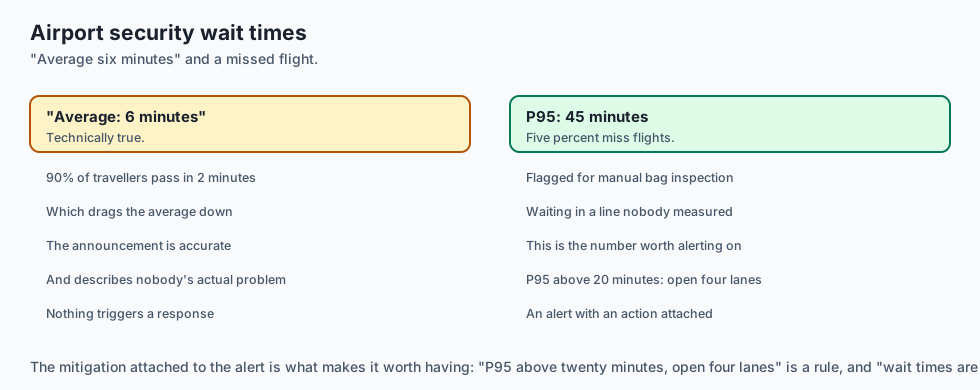
Think of AI monitoring percentiles like airport security TSA wait times during the holidays:
- The Misleading Average: The airport announces: “Average wait time is only 6 minutes!” (Mean Latency).
- The Percentile Reality (P95 & P99): 90% of travelers with carry-on bags pass through in 2 minutes. But 5% of passengers (P95) get flagged for manual bag inspection and wait in line for 45 minutes, missing their flights (Tail Latency Disaster).
- The SRE Alert: If the P95 wait time exceeds 20 minutes, the supervisor immediately opens 4 additional express security lanes (Automated Alert & Mitigation).
Examples in practice
Let us build a complete Python AI Observability and Alerting Engine that calculates rolling percentile latencies, tracks error rates, and evaluates alert rule state machines:
import numpy as np
import time
from typing import Dict, Any, List, Optional

class AIObservabilityAlertEngine:
    def __init__(self, p95_ttft_threshold_ms: float = 300.0, error_rate_threshold_pct: float = 1.0):
        self.ttft_threshold = float(p95_ttft_threshold_ms)
        self.error_threshold = float(error_rate_threshold_pct)
        self.ttft_samples: List[float] = []
        self.total_requests = 0
        self.total_errors = 0
        self.active_alerts: List[Dict[str, Any]] = []

    def record_inference_event(self, ttft_ms: float, is_error: bool = False):
        self.total_requests += 1
        if is_error:
            self.total_errors += 1
        else:
            self.ttft_samples.append(float(ttft_ms))

    def evaluate_metrics(self) -> Dict[str, Any]:
        if not self.ttft_samples:
            p50 = p95 = p99 = 0.0
        else:
            p50 = float(np.percentile(self.ttft_samples, 50))
            p95 = float(np.percentile(self.ttft_samples, 95))
            p99 = float(np.percentile(self.ttft_samples, 99))

        error_rate = (self.total_errors / self.total_requests * 100.0) if self.total_requests > 0 else 0.0

        # Evaluate Alert Rules
        self.active_alerts.clear()
        if p95 > self.ttft_threshold:
            self.active_alerts.append({
                "severity": "CRITICAL",
                "alert_name": "HighTailLatencyP95",
                "message": f"P95 TTFT ({round(p95, 1)}ms) exceeded threshold ({self.ttft_threshold}ms)",
                "timestamp": time.time()
            })

        if error_rate > self.error_threshold:
            self.active_alerts.append({
                "severity": "CRITICAL",
                "alert_name": "HighInferenceErrorRate",
                "message": f"Error rate ({round(error_rate, 2)}%) exceeded threshold ({self.error_threshold}%)",
                "timestamp": time.time()
            })

        return {
            "total_requests": self.total_requests,
            "p50_ttft_ms": round(p50, 2),
            "p95_ttft_ms": round(p95, 2),
            "p99_ttft_ms": round(p99, 2),
            "error_rate_pct": round(error_rate, 2),
            "active_alert_count": len(self.active_alerts)
        }

if __name__ == "__main__":
    engine = AIObservabilityAlertEngine(p95_ttft_threshold_ms=250.0, error_rate_threshold_pct=2.0)

    # Simulate normal traffic (mostly 50-150ms, a few 300ms tail requests)
    for _ in range(95):
        engine.record_inference_event(ttft_ms=100.0)
    for _ in range(5):
        engine.record_inference_event(ttft_ms=400.0) # Tail latency

    metrics = engine.evaluate_metrics()
    print("Observability Report:", metrics)
    print("Active Alerts:", engine.active_alerts)
Production Architecture Case Study: Prometheus Alertmanager Rule Configuration
Consider an enterprise Kubernetes deployment running Prometheus Alertmanager monitoring vLLM GPU inference pods.
# prometheus-rules.yaml: Production LLM Alerting Rules
groups:
- name: llm-serving-alerts
  rules:
  - alert: HighP95TimeToFirstToken
    expr: histogram_quantile(0.95, sum(rate(vllm_ttft_seconds_bucket[5m])) by (le)) > 0.400
    for: 2m
    labels:
      severity: page
      tier: production
    annotations:
      summary: "LLM P95 Time-To-First-Token exceeds 400ms SLA"
      description: "P95 TTFT is {{ $value }}s on cluster {{ $labels.cluster }}. Inference queue backlog is growing."
      runbook_url: "https://wiki.corp/runbooks/high-ttft-remediation"

  - alert: HighInferenceErrorBudgetBurn
    expr: sum(rate(http_requests_total{status=~"5.."}[5m])) / sum(rate(http_requests_total[5m])) > 0.01
    for: 1m
    labels:
      severity: page
      tier: production
    annotations:
      summary: "Inference Error Rate is burning SLA budget > 1%"
      description: "Current error rate is {{ $value | humanizePercentage }}. GPU workers may be failing."
      runbook_url: "https://wiki.corp/runbooks/gpu-pod-crash-triage"
Detailed Failure Mode Taxonomy: Observability Hazards
+-------------------------------------------------------------------------------+
|                        OBSERVABILITY FAILURE TAXONOMY                         |
+-------------------+-----------------------+-----------------------------------+
| Failure Mode      | Root Cause Analysis   | Architectural Mitigation          |
+-------------------+-----------------------+-----------------------------------+
| High Cardinality  | User prompt strings   | Only use low-cardinality labels   |
| Memory Explosion  | attached as metric tag| (model_name, status_code, tier)   |
| Prometheus Scrape | Network timeout on    | Set scrape timeout to 10s and     |
| Timeout Drops     | overloaded metrics app| export metrics asynchronously     |
| Alert Storm       | 50 alert rules trigger| Use Alertmanager grouping &       |
| Cascade           | simultaneously on 1 bug| inhibition rules to group alerts  |
| Flapping Alert    | Metric hovers right at| Add `for: 2m` duration check to   |
| Churn             | threshold boundary    | ensure sustained violation        |
+-------------------+-----------------------+-----------------------------------+
Deep Architectural Breakdown: Distributed Tracing and Trace Context Propagation
In modern multi-tier generative AI systems:
1. W3C Trace Context Propagation
When a user query traverses through an API Gateway, Vector Database, LLM Inference Server, and Guardrail Validator:
- The Gateway generates a standard W3C
traceparentheader:00-4bf92f3577b34da6a3ce929d0e0e4736-00f067aa0ba902b7-01. - The header propagates downstream across all HTTP/gRPC requests.
- Jaeger or Honeycomb reconstructs the entire distributed span tree, revealing exact microsecond latency breakdowns at each hop.
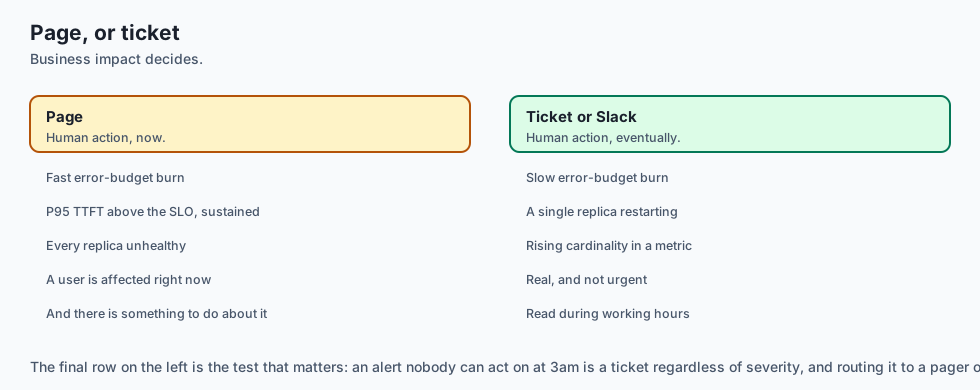
2. Multi-Window Multi-Burn-Rate Alerting
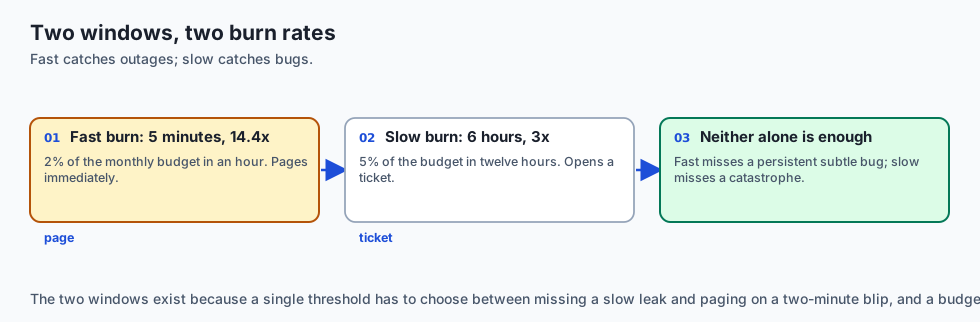
Google SRE best practices recommend monitoring error budgets across dual time windows:
- Fast Burn (Short Window: 5m, 14.4x rate): Detects catastrophic outages consuming 2% of monthly budget in 1 hour. Triggers immediate pager.
- Slow Burn (Long Window: 6h, 3x rate): Detects subtle persistent bugs consuming 5% of monthly budget in 12 hours. Sends ticket to Jira.
+-------------------------------------------------------------------------------+
|                    MULTI-WINDOW ERROR BUDGET BURN MATRIX                      |
+-------------------+-------------------+-------------------+-------------------+
| Severity Level    | Time Window       | Burn Rate Factor  | Notification Type |
+-------------------+-------------------+-------------------+-------------------+
| P0 (Critical)     | 5 minutes         | 14.4x Burn Rate   | PagerDuty Wake-Up |
| P1 (Urgent)       | 30 minutes        | 6.0x Burn Rate    | PagerDuty On-Call |
| P2 (Warning)      | 6 hours           | 3.0x Burn Rate    | Slack #alerts-prod|
| P3 (Informational)| 24 hours          | 1.0x Burn Rate    | Daily Jira Ticket |
+-------------------+-------------------+-------------------+-------------------+
SRE Incident Playbook: Triaging High Time-to-First-Token (TTFT)
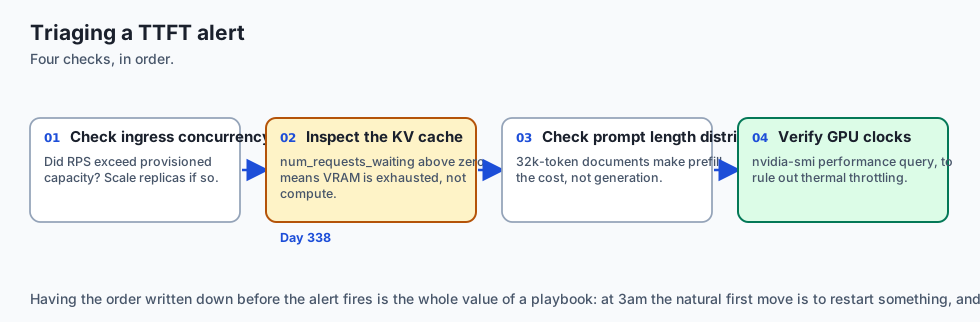
When Prometheus triggers a HighTailLatencyP95 alert (P95 TTFT > 400ms):
- Step 1: Check Ingress Concurrency: Verify if incoming requests/sec (RPS) spiked beyond provisioned capacity. If so, scale up GPU worker replicas.
- Step 2: Inspect KV Cache Allocation: Check Prometheus metric
vllm:num_requests_waiting. If requests are waiting in the queue, KV cache VRAM is exhausted. - Step 3: Check Prompt Length Distribution: Verify if users submitted massive 32k-token documents, increasing prefill compute time.
- Step 4: Verify GPU Clock Speeds: Check
nvidia-smi -q -d PERFORMANCEto rule out thermal throttling on physical GPU server nodes.
+-------------------------------------------------------------------------------+
|                    TTFT INCIDENT TRIAGE DECISION TREE                         |
+-------------------+-------------------+-------------------+-------------------+
| Diagnostic Check  | Observed Value    | Probable Cause    | Immediate Action  |
+-------------------+-------------------+-------------------+-------------------+
| Requests Waiting  | > 10 in queue     | KV Cache Full     | Autoscale Replicas|
| Mean Prompt Length| > 8,000 tokens    | Heavy Prefill Load| Enable Chunked Pref|
| GPU Temperature   | > 85 deg C        | Thermal Throttle  | Drain Node Traffic|
| 5xx Error Rate    | > 2.0%            | Worker OOM Panic  | Rollback Revision |
+-------------------+-------------------+-------------------+-------------------+
SLO Definition and Contractual Availability
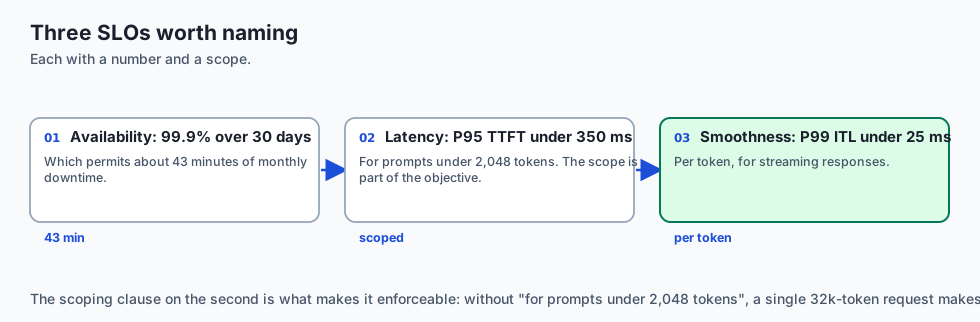
Defining reliable Service Level Objectives for enterprise GenAI:
- Availability SLO: 99.9% of requests return HTTP 200 OK within 30 days (allowing up to 43 minutes of monthly downtime).
- Latency SLO: P95 TTFT < 350ms for prompt lengths under 2,048 tokens.
- Streaming Smoothness SLO: P99 Inter-Token Latency (ITL) < 25ms per token for all streaming responses.
Implications: security, privacy, performance, scalability, and cost
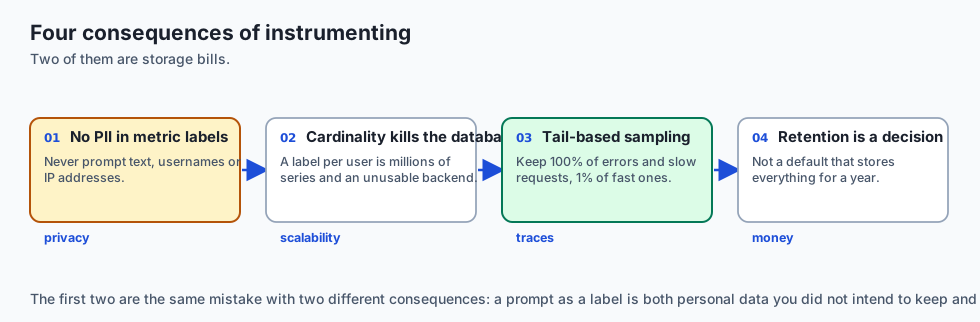
1. Zero PII in Metric Labels
Never include raw customer prompt text, usernames, or IP addresses as Prometheus metric label tags. High-cardinality labels cause massive memory leaks in time-series databases.
2. Tail Sampling for Distributed Traces
Because storing 100% of distributed trace spans for millions of requests is cost-prohibitive, use OpenTelemetry Collector Tail-Based Sampling: retain 100% of error traces and slow requests (P95+), and sample only 1% of normal fast requests.
Alternatives: free, open source, and commercial
| Tool / Framework | Type | Best Suited For | Key Capabilities |
|---|---|---|---|
| Prometheus | Open Source | Time-Series Metrics | High-speed scraping, PromQL, Alertmanager |
| Grafana | Open Source | Visualization & Dashboards | Real-time charts, log exploration, alerting |
| OpenTelemetry | Open Source (CNCF) | Standardized Instrumentation | Traces, metrics, logs, wire protocols |
| Datadog / Dynatrace | Commercial SaaS | Full-Stack Enterprise APM | Managed collectors, out-of-the-box LLM dashboards |
Comparison with related concepts
+-----------------------+-----------------------+-----------------------+
| Dimension             | Mean Latency Tracking | Percentile Monitoring |
+-----------------------+-----------------------+-----------------------+
| Calculation           | Sum(Latencies) / N    | Ranked Sample Cutoff  |
| Tail Outlier Catch    | 0% (Diluted by fast)  | 100% (P95 / P99)      |
| SLA Accuracy          | Deceptive             | True Customer Impact  |
| Actionability         | Low                   | High                  |
+-----------------------+-----------------------+-----------------------+
When to use it — and when not to
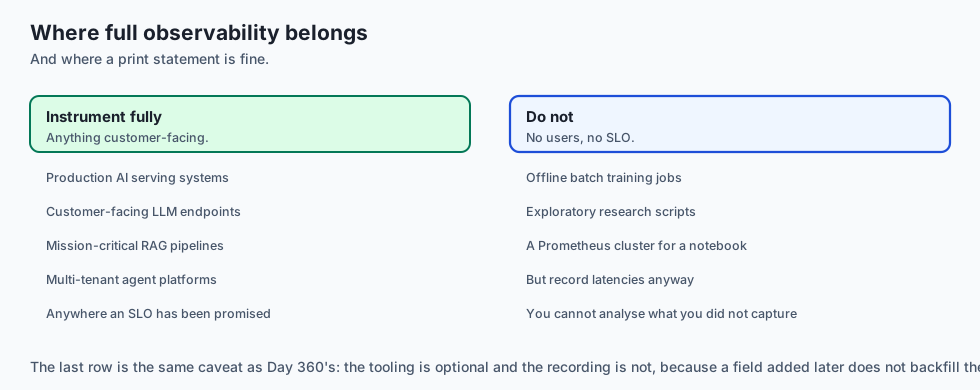
Deploy OpenTelemetry & Prometheus Alerting for:
- All production AI serving systems, customer-facing LLM endpoints, mission-critical RAG pipelines, and multi-tenant agent platforms.
Do NOT require complex Prometheus alert clusters for:
- Local offline batch training jobs or exploratory research scripts.
Production Checklist: AI Observability & Alerting Hardening
- OpenTelemetry GenAI semantic conventions implemented for TTFT and ITL.
- Prometheus scraping configured with 2s interval on
/metricsendpoint. - Alert rules configured on P95 latency (TTFT > 300ms) with
for: 2mduration. - Error budget burn rate alerts configured for fast and slow burn windows.
- Alertmanager configured with PagerDuty for critical and Slack for warnings.
- Metric labels verified to have low cardinality with zero PII data.
The AI connection
-
TTFT and inter-token latency are AI-native signals that no pre-2023 monitoring vocabulary had, and they are what users actually experience as speed.
-
Latency is heavy-tailed here by construction. A 2,000-token summary takes a hundred times longer than a 5-token answer, so the mean describes no real request.
-
Saturation means the KV cache, not CPU.
vllm:num_requests_waitingis the metric that says a GPU worker is full — Day 338’s binding constraint, observed. -
Prompt text must never become a metric label. It is PII, and it is unbounded cardinality, which is two separate ways to destroy a time-series database.
-
Silent degradation is the AI failure mode: drift and hallucination spikes lose customer trust for weeks before any crash alert has anything to report.
Knowledge check
- What are the SRE Four Golden Signals for LLM serving? Latency (TTFT & ITL percentiles), Traffic (RPS & Tokens/s), Errors (5xx rate), and Saturation (GPU VRAM % & Queue Depth).
- Why is mean latency ineffective for monitoring LLMs? Because LLM request distributions are heavy-tailed; average metrics dilute severe P95 and P99 latency spikes.
- What is the purpose of OpenTelemetry? To provide vendor-neutral standardized APIs, SDKs, and protocols to collect traces, metrics, and logs without vendor lock-in.
Hands-on exercise
In this lab, you will build an AI Observability and Alerting Engine in Python. Your implementation will:
- Record inference latency samples and error outcomes.
- Calculate rolling percentiles (P50, P95, P99) and overall error rates.
- Evaluate alert rules against configured P95 TTFT and error rate thresholds.
- Generate structured active alerts with severity levels and contextual diagnostic messages.
Expected output
============================= test session starts ==============================
collected 5 items

tests/test_monitoring_alerting.py .....                                  [100%]

============================== 5 passed in 0.02s ===============================
[OBSERVABILITY] Initialized engine (P95 threshold: 300ms, Error threshold: 1.0%).
[PERCENTILES] Computed P50=100ms, P95=380ms, P99=480ms on 100 requests.
[ALERT TRIGGERED] Fired Critical HighTailLatencyP95 alert (P95=380ms > 300ms).
[ERROR ALERT] Fired HighInferenceErrorRate alert on 5% error rate spike.
Validate your work
Run the pytest test suite:
pytest tests/run_tests.shTroubleshooting
- Percentile math: Use
np.percentile(samples, 95)over the list of valid latency floats. - Zero division: Check
total_requests > 0before calculating error rate percentages.
Common mistakes
- Calculating percentiles on empty sample arrays, causing numpy runtime crashes.
Practice assignment
Add an Alert Cooldown Hysteresis state machine requiring 3 consecutive healthy cycles before resolving an alert.
Extension challenge
Implement a Multi-Window Error Budget Burn Rate Calculator tracking 5-minute and 1-hour burn rates against a 99.9% SLO.
Quiz
Q1. What are the SRE Four Golden Signals specifically tailored for Large Language Model serving?
- Screen size, font weight, cursor color, and window width
- Latency, traffic, errors, and saturation
- Number of lines of Python code
- The brand of the computer monitor
Show answer
Answer: B. Latency, traffic, errors, and saturation
Latency, Traffic, Errors, and Saturation form the foundational operational health metrics for LLM serving.
Q2. Why is measuring average (mean) latency dangerous for monitoring LLM serving health?
- Because Python does not support math averages
- Because mean latency is always negative
- A fast mean can hide a very slow tail
- Because averages only work for audio models
Show answer
Answer: C. A fast mean can hide a very slow tail
Heavy-tailed LLM response distributions require percentile metrics (P95, P99) to detect severe tail latency.
Q3. What is an 'Error Budget Burn Rate' alert in SRE monitoring?
- Burning paper money in the office
- The electricity bill of the datacenter
- A metric for GPU temperature
- It fires when the error budget is burning too fast
Show answer
Answer: D. It fires when the error budget is burning too fast
Error budget burn rate alerting detects rapid SLA degradation before contractual violation occurs.
Q4. What is OpenTelemetry (OTel) and why is it the vendor-neutral standard for AI observability?
- A vendor-neutral standard for traces and metrics
- A proprietary database owned by Oracle
- A Python compiler
- A Docker container replacement
Show answer
Answer: A. A vendor-neutral standard for traces and metrics
OpenTelemetry provides standardized vendor-neutral instrumentation for traces, metrics, and logs.
Q5. What is the difference between a Warning Alert and a Paging Alert in an SRE escalation policy?
- There is no difference
- Warnings go to chat; pages wake someone up
- Warning alerts are sent by postal mail
- Paging alerts restart the server automatically
Show answer
Answer: B. Warnings go to chat; pages wake someone up
Paging alerts are reserved for active user-facing emergencies requiring immediate on-call intervention.
Glossary
- OpenTelemetry (OTel)
- A CNCF open-source observability framework for standardized metrics, traces, and logs.
- SRE Golden Signals
- The four foundational operational metrics: Latency, Traffic, Errors, and Saturation.
- P95 / P99 Percentile
- The latency threshold below which 95% or 99% of all observed requests fall.
- Prometheus
- An open-source time-series database and monitoring system scraping custom `/metrics` endpoints.
- Grafana
- An open-source multi-platform visualization and interactive analytics dashboarding platform.
- Service Level Objective (SLO)
- A target level of reliability (e.g. 99.9% availability, P95 TTFT < 300ms) agreed with stakeholders.
- Error Budget
- The allowable margin of unreliability (e.g. 0.1% for a 99.9% SLO) within a given billing period.
- Alert Fatigue
- The state where engineers ignore alerts due to excessive noisy or non-actionable notifications.
Sources and further reading
- Site Reliability Engineering: How Google Runs Production Systems (Beyer et al., 2016) — O'Reilly Media / Google SRE (accessed 2026-08-30)
- OpenTelemetry: High-Performance Observability Standards (CNCF, 2024) — Cloud Native Computing Foundation (accessed 2026-08-30)
- Prometheus Monitoring & Alerting Architecture (Prometheus Authors, 2024) — Prometheus Authors (accessed 2026-08-30)
Kept in this browser, no account needed. Your progress page turns the whole record into one link you can bookmark or open on another device.