Computing Foundations › How the Internet Works › Day 21
Day 21: Inspecting Traffic with curl and Developer Tools
After this lesson you will be able to see any HTTP request and response on the wire — with curl and browser Developer Tools — and follow a systematic decision tree to diagnose exactly where a failed request went wrong.
Hands-on lab for this lesson
Lab files on GitHub: https://github.com/ai-roadmap-365/ai-roadmap-365.github.io/tree/main/labs/sections/computing-foundations/day-021-inspecting-traffic-with-curl-and-developer
- Get the hands-on files. Clone the labs repository once (you can reuse this clone for every lesson). This works on macOS, Linux, and Windows (PowerShell or WSL):
git clone https://github.com/ai-roadmap-365/ai-roadmap-365.github.io.git cd ai-roadmap-365.github.io - Open this lesson's lab. Move into the directory for this specific day. Every lab lives at the same predictable path — section / subsection / week / day:
cd labs/sections/computing-foundations/day-021-inspecting-traffic-with-curl-and-developer - Read the lab guide. Open `README.md` in that directory. It lists the exact commands, what each does, the expected output, and how to check your work — read it before running anything.
- Run it and check your work. Follow the README's "How to run" section: run the example first to see the finished result, then complete the numbered exercises in `starter/`, then run the tests. The tests pass (exit 0) only when your work is correct.
bash tests/run_tests.sh # or the test command named in the lab README
You can also open the lab as a local page (works offline, shows the file tree and expected output).
Learning objectives
By the end of this lesson you will be able to:
- Use curl to inspect a full request and response with -v, and read the request (>), response header (<), and connection (*) lines
- Apply the essential curl flags — -I, -L, -H, -X, -d, -w, -o, -s, --resolve — each to reveal or control one named part of an HTTP exchange
- Read the Developer Tools Network tab: interpret the Status, Type, Size, Time, and Waterfall columns and drill into a single request's headers, payload, and timing
- Follow a redirect chain with -L and read status codes deliberately, distinguishing 2xx success from 4xx client errors and 5xx server errors
- Walk a systematic failed-request decision tree — DNS, connection, TLS, status, body — naming the tool that answers each gate
- Choose the right inspection tool for a task, comparing curl, HTTPie, Postman, Wireshark, and mitmproxy on when each earns its place
- Reproduce a failing API call outside your own code with curl to isolate whether the fault is yours or the server's
Prerequisites
- Days 15-20: how a page loads, IP/DNS/routing, TCP/UDP/ports, HTTP methods, and HTTPS/TLS
- A terminal with curl (preinstalled on macOS and Linux) and any modern web browser
- Comfort running commands in a terminal (Days 8-14)
Why this matters
For a week you have followed a request across the internet: what happens when you load a page, then IP addresses and DNS and routing, then TCP and UDP and ports, then HTTP, then the TLS handshake that makes it HTTPS, and finally the browser turning bytes into pixels. All of that machinery is invisible while it works. The moment it stops working — a page that will not load, an API that answers with a cryptic number, a login that silently fails — you need to make it visible again. Today you learn to do exactly that: to see the request and the response on the wire, byte for byte, and to reason from what you see to what is broken.
This is the difference between guessing and knowing. When you eventually call a hosted model endpoint from your own code and it answers 401 Unauthorized, or 429 Too Many Requests, or 500 Internal Server Error, or returns text that your program cannot parse, you have two choices. You can stare at your source code and rearrange it hopefully, or you can reproduce the exact request outside your program, read the exact response, and fix the one thing that is actually wrong. The engineers who debug fastest reach for the second path every time, and the tool they reach for is almost always curl: one command that sends any request you can describe and shows you everything that comes back.
The stakes are concrete. A misread status code sends you rewriting working code for an hour when the real problem was a missing header. A request you cannot reproduce outside your application is a bug you cannot isolate, which means a bug you cannot reliably fix. Time, in debugging, is mostly the time you spend not knowing where the problem is. The tools in this lesson collapse that time by letting you look. This is the practical capstone of the whole networking category: everything you learned about how a request travels, you will now learn to observe and diagnose.
The idea in plain language
Two families of tools let you inspect network traffic, and you will use both constantly.
The first is curl, a command-line program that makes a single HTTP request and prints the result. You type a command, curl sends the request you described, and the response comes back to your terminal. Because you control every detail — the URL, the method, the headers, the body — and because you see every detail of what returns, curl is the most precise way to ask “what does the server actually do when I send exactly this?” There is no browser, no framework, and no application code in the way to hide or change anything.
The second is your browser’s Developer Tools, and specifically its Network tab. A modern web page makes dozens or hundreds of requests — the HTML, then stylesheets, images, fonts, and a stream of background API calls. The Network tab records every one of them as it happens and lets you click any single request to see its method, its status, its headers, its timing, and its response body. Where curl is a scalpel for one request you compose by hand, the Network tab is a flight recorder for everything a real page actually did.
Underneath both is a single skill: reading a request and its response as a structured object with named parts, and knowing which part to check when something is wrong. Was the hostname even found? Did the connection open? Did the encryption succeed? What status number came back? Was the body the shape you expected? A failed request is never just “broken”; it failed at one specific stage, and naming that stage is most of the fix. The tools show you the stages. This lesson teaches you to read them.
Historical background
curl began in 1996 as a small utility named httpget, written by the Swedish developer Daniel Stenberg, who wanted a command-line way to fetch currency-exchange rates for an internet relay chat bot. It was renamed curl — for “client for URLs” — in 1998, and it has been maintained continuously ever since, with Stenberg still its lead developer nearly three decades later. Under the hood sits libcurl, a reusable transfer library first released in 2000, which is now embedded in an astonishing range of software: cars, televisions, phones, printers, game consoles, and the runtimes of most programming languages. When some other program makes an HTTP request, there is a very good chance libcurl is doing the actual work. Few pieces of software are so widely deployed and so little noticed.
Browser developer tools have a shorter, faster history. In the early 2000s, web developers debugged by inserting alerts and reloading endlessly. Firebug, a Firefox extension released in 2006 by Joe Hewitt, changed that by adding an inspector, a console, and a network monitor directly in the browser. Its ideas were so obviously right that every major browser built them in: Chrome shipped its Developer Tools with the browser’s first release in 2008, and today Chrome, Firefox, Safari, and Edge all ship a Network panel that descends directly from Firebug’s. The web platform standardized much of what these panels report, so the columns you will read — status, type, size, time — mean the same thing across browsers.
The theme across both histories is that the web was built to be inspectable. HTTP is a text-based protocol whose messages a human can read; the browser is required to fetch resources over that protocol; and the tooling that grew up around it exposes those messages rather than hiding them. That openness is not an accident. It is why the network can be debugged at all, and it is why the same two tools have stayed useful across twenty-five years of change on the web.
What it is — and what it is not
Traffic inspection is the practice of observing the actual HTTP messages exchanged between a client and a server — the real request that left your machine and the real response that came back — instead of inferring them from application behavior. curl is a client that composes and sends one such message on demand and prints what returns. Developer Tools is an observer that records the messages a browser already sent and lets you replay and read them. Both answer the same question: not “what do I think happened?” but “what actually crossed the wire?”
It is worth being clear about what these tools are not. They are not a fix; they are a light. curl does not repair a broken server, and the Network tab does not correct your code — they only let you see precisely enough to know what to change. They are also not a general packet sniffer: curl and Developer Tools work at the level of HTTP requests and responses, the layer you will spend nearly all your debugging time in, not at the level of individual TCP or IP packets. A separate class of tools, discussed later, drops down to the raw packets when you truly need to. And traffic inspection is not testing: a passing curl command tells you the server answered correctly once, from your machine, right now — not that it will for every input, every user, and every load. Inspection tells you what is; testing tells you what holds.
Why it was created and what problems it solves
Every tool here exists to answer one recurring, expensive question: when a request does not do what I expected, what exactly went wrong? Without inspection you are reduced to symptoms — “the page is blank,” “the app shows an error,” “it works on my machine” — and symptoms rarely point at causes. A blank page might be a failed request, a wrong status, a valid response your code mishandled, or a resource blocked by the browser. Each has a different fix, and you cannot tell them apart from the symptom alone.
curl solves the reproduction problem. A bug you can only trigger by clicking through an entire application is slow to investigate and easy to misattribute. Reduce it to a single curl command and you have isolated it: the command either reproduces the failure or it does not, and either answer is progress. If curl succeeds where your program fails, the fault is in your program, not the server. If curl fails the same way, you can now vary one thing at a time — one header, one field, one URL — until the response changes, and the thing you changed is the cause. This is the core discipline of debugging: shrink the failing case until only the cause remains.
Developer Tools solves the observation problem for real pages. Modern web applications are too complex to reason about from the outside; a single click may fire a dozen background requests, and any one of them can be the culprit. The Network tab makes that hidden conversation visible, in order, with timing, so you can find the one slow, failed, or malformed request among the many that succeeded. Together the two tools turn “it is broken” into “this request, at this stage, returned this — here is why,” which is the sentence every fix begins with.
How it works
At its heart, inspecting traffic means composing a request from its named parts and reading a response by its named parts. Let us build up curl from the pieces, then look at how Developer Tools presents the same pieces for a whole page.
The anatomy of a curl command
Type curl https://example.com and, with no options, curl makes a GET request and prints the response body to your terminal. Everything else is controlled by flags that add to or reveal parts of the exchange. The single most important flag for debugging is -v (verbose), which prints the entire conversation: the lines beginning with > are the request curl sent, the lines beginning with < are the response headers the server returned, and lines beginning with * are curl’s own notes about resolving the host, opening the connection, and completing the TLS handshake. In one command you see all the networking layers from the past week laid out in order.
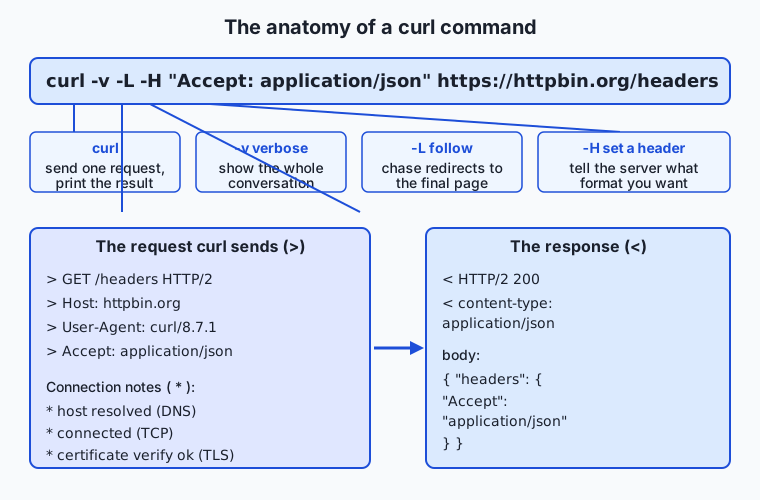
The other flags each control one named part of the exchange. The table below lists the ones you will use daily; the lesson’s lab exercises every one of them against a real server.
| Flag | What it does | Why you reach for it |
|---|---|---|
-v | Verbose: prints the full request (>), response headers (<), and connection notes (*) | The default debugging view — see everything at once |
-I | Fetch headers only (a HEAD request); prints the status line and response headers | Check status and headers without downloading the body |
-L | Follow redirects to the final destination | A 301/302 is not the answer; -L chases it to the real one |
-H | Set a request header, e.g. -H "Accept: application/json" | Servers change their answer based on the headers you send |
-X | Set the HTTP method, e.g. -X POST or -X DELETE | Exercise methods a browser will not send for you |
-d | Send a request body, e.g. -d '{"q":"hi"}'; implies POST | Reproduce the exact payload your code sends |
-w | Write out chosen variables after transfer, e.g. -w "%{http_code}" | Extract just the status, or a full timing breakdown |
-o / -s | Write the body to a file (-o) or silence the progress meter (-s) | Keep output clean when you only care about status or timing |
--resolve | Force a hostname to a specific IP for this request | Test a new server before DNS points to it |
Two more capabilities matter often. The -w flag reads timing variables that curl measures for every transfer: time_namelookup (DNS resolution), time_connect (TCP connection established), time_appconnect (TLS handshake complete), time_starttransfer (first byte of the response, often called time to first byte), and time_total. Printing these turns curl into a stopwatch that tells you which stage was slow, not merely that something was. And curl handles cookies with -c to save them to a file and -b to send them back, letting you reproduce a session that a plain request would not have.
Reading the DevTools Network tab
Open Developer Tools (in Chrome, press F12 or Command-Option-I on a Mac; the equivalents in Firefox, Safari, and Edge are nearly identical) and select the Network tab, then reload the page. Every request the page makes appears as a row, and the columns describe each one. The table below names the columns you will read most.
| Column | What it tells you | What to watch for |
|---|---|---|
| Name | The resource requested (file or endpoint) | Find the specific request you care about |
| Status | The HTTP status code returned | Red rows are 4xx/5xx failures; look here first |
| Type | The kind of resource (document, script, fetch, image, font) | Filter to Fetch/XHR to see only API calls |
| Initiator | What caused the request (which script or page) | Trace a mystery request back to the code that fired it |
| Size | Bytes transferred, and whether it was served from cache | A surprisingly large or uncached download |
| Time | How long the request took end to end | The slow request in a slow page |
| Waterfall | A timeline bar showing each request’s timing phases | Where the time actually went across all requests |
Click any row and a detail pane opens with sub-tabs: Headers shows the request and response headers and the status; Payload shows the request body you sent; Response (or Preview) shows the body that came back; and Timing breaks the single request into the same phases curl -w reports — DNS, connecting, TLS, waiting for the first byte, and downloading. The waterfall on the right assembles all of these into one picture of the page, so a long bar or a late-starting request jumps out. A filter box at the top narrows the list; typing a word matches by name, and the type buttons (Fetch/XHR, JS, CSS, Img) hide everything else so you can focus on, say, only the API calls your application made.
A systematic method for a failed request
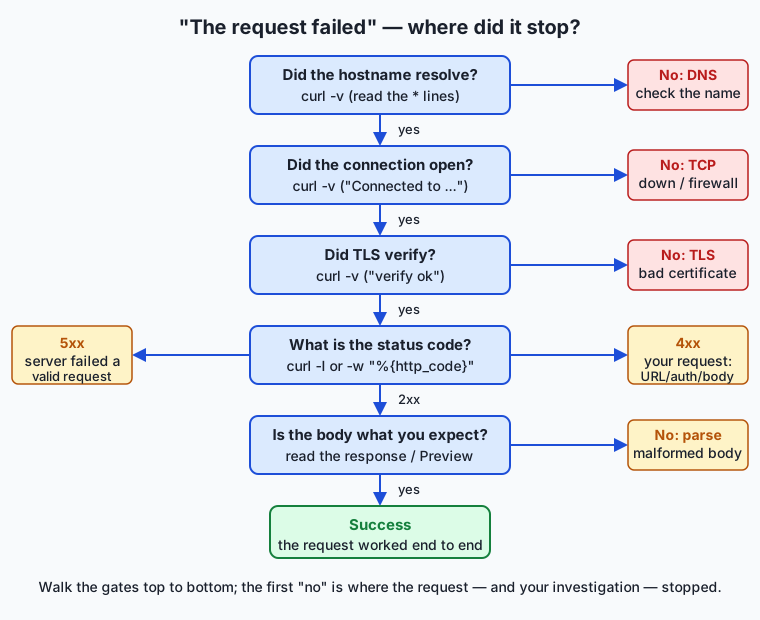
The decision tree above turns “the request failed” into a short, ordered set of yes/no questions, each with a tool that answers it. Did the hostname resolve to an IP? If not, the problem is DNS — check the name for typos and confirm it resolves. Did the TCP connection open? If not, the server may be down, or a port or firewall is blocking you. Did the TLS handshake succeed? If not, the certificate is expired, untrusted, or mismatched. Did a response come back, and with what status? A 2xx means success; a 4xx means you sent something wrong (wrong URL, missing authentication, bad input); a 5xx means the server failed handling an otherwise valid request. Only once you have a 2xx do you ask the last question: is the body the shape you expected — valid, complete, parseable? Walking these gates in order means you never rewrite your request-sending code to fix a problem that was actually in DNS, and you never blame the server for a 4xx that your own request caused.
An everyday analogy
Think of an HTTP request as a parcel you send through a courier, and the response as the delivery outcome that comes back. When a parcel goes missing, you do not tear apart your whole shipping operation at random; you check the tracking history stage by stage.
curl -v is that full tracking history printed for a single parcel: the * lines are the courier’s internal notes — address looked up, sorting facility reached, security checkpoint cleared — and the > and < lines are the shipping label you wrote and the delivery receipt that came back. The status code is the receipt’s outcome stamp: 200 is “delivered,” 404 is “no such address,” 401 is “recipient refused — no valid identification,” 429 is “too many parcels, come back later,” and 500 is “the depot caught fire while handling your perfectly valid parcel.” A redirect (301/302) is a “recipient has moved — forwarding to a new address” slip, and curl -L is you saying “follow the forwarding slips until the parcel actually arrives” rather than stopping at the first one.
The Developer Tools Network tab, by contrast, is the dispatcher’s board for every parcel your operation sent today: hundreds of rows, each with its destination, its outcome stamp, its weight, and how long it took, with a timeline showing which went out when. When customers complain the whole shipment is late, you scan the board for the one red row or the one bar that stretches far past the others. And the decision tree is the dispatcher’s laminated checklist: address valid? facility reached? checkpoint cleared? receipt stamp? contents correct? You run it top to bottom, and the first “no” is where the parcel — and your investigation — stopped. The analogy holds all the way down because the web really was built like a postal system with named stages, which is exactly why it can be traced.
Examples in practice
Start with the most useful single command. Running curl -v https://example.com and reading the connection notes shows the networking week in one screen:
* Host example.com:443 was resolved.
* IPv4: 104.20.23.154, 172.66.147.243
*   Trying 104.20.23.154:443...
* Connected to example.com (104.20.23.154) port 443
* ALPN: server accepted h2
* SSL connection using TLSv1.3 / AEAD-CHACHA20-POLY1305-SHA256
* Server certificate:
*  subject: CN=example.com
*  SSL certificate verify ok.
> GET / HTTP/2
> Host: example.com
> User-Agent: curl/8.7.1
> Accept: */*
>
< HTTP/2 200
< content-type: text/html
Read it as the decision tree in action: the host resolved (DNS is fine), the connection opened (TCP is fine), the certificate verified (TLS is fine), and the status is 200 (success). If any line had failed, that line would be exactly where to look.
Next, follow a redirect. curl -IL https://httpbin.org/redirect/1 requests headers only and follows the forwarding slip. You see two status blocks: first HTTP/2 302 with a location: /get header, then HTTP/2 200 after curl follows it to the real destination. Without -L, you would stop at the 302 and wrongly conclude the endpoint returned no data — a classic misread.
Now confirm what you actually sent. The service at https://httpbin.org/headers echoes back the request headers it received, so curl -H "Accept: application/json" https://httpbin.org/headers returns:
{
  "headers": {
    "Accept": "application/json",
    "Host": "httpbin.org",
    "User-Agent": "curl/8.7.1"
  }
}
This is how you verify that a header you think you are sending is really going out — invaluable when an API behaves as if it never received your authentication or content-type header.
Read status codes deliberately. curl -o /dev/null -s -w "%{http_code}\n" https://httpbin.org/status/404 throws away the body, silences the progress meter, and prints just 404 — a clean way to check a status in a script. Point it at /status/500 and you will get a 5xx code (httpbin’s error endpoints are themselves subject to gateway hiccups under load, so you may see 500, 502, 503, or 504 — all of which tell the same story: the failure is the server’s, not your request’s).
Finally, measure where time goes. A timing breakdown for a real site:
curl -o /dev/null -s -w "dns:%{time_namelookup} connect:%{time_connect} tls:%{time_appconnect} ttfb:%{time_starttransfer} total:%{time_total}\n" https://example.com

dns:0.003577 connect:0.015769 tls:0.034880 ttfb:0.048609 total:0.048788
The numbers are seconds. DNS took under four milliseconds, the connection was open by sixteen milliseconds, TLS finished at thirty-five, and the first byte arrived at forty-nine — so nearly all the time here was the TLS handshake and the round trip to the server, not the download. When a request feels slow, this one line tells you which stage to blame.
Here is the payoff you will feel most often. When you call a hosted model endpoint and your program reports a failure, reproduce it with curl: send the same URL, the same -H headers, and the same -d body, and read the status and response. A 401 means your credentials or authentication header are wrong or missing; a 429 means you are sending requests too fast and must slow down or back off; a 400 means your request body is malformed — often invalid JSON or a missing field, which the response body will usually name; and a 500 means the server erred on a request it accepted. Reading the exact code and the exact error message from curl — outside your application, with nothing in the way — is the fastest route from “my code does not work” to “here is the one thing to change.”
Implications: security, privacy, performance, scalability, and cost
Security
Traffic inspection is the primary way you confirm that security is actually working — that HTTPS negotiated a modern protocol, that a certificate verified, that an authentication header is present and a session cookie is set with sensible flags. But the same visibility cuts both ways. A verbose trace or a Network-tab export contains real secrets: authentication tokens, cookies, and personal data all appear in plain text once you can read the request. Treat that output as sensitive. Never paste a raw -v dump or a saved network log into a public forum, issue tracker, or chat without first redacting the Authorization header, cookies, and anything that identifies a person. The tools that let you see the traffic let everyone you share the output with see it too.
Privacy
Because inspection reveals every field that crosses the wire, it also reveals how much a page discloses about its user — third-party requests, tracking identifiers in query strings, and cookies sent to domains other than the one you visited. Learning to read the Network tab is, incidentally, learning to audit what a site tells others about you. For your own work, the discipline is to send only what a request needs and to keep captured traffic — which may contain user data — out of logs and screenshots that outlive their usefulness.
Performance
Every timing breakdown in this lesson is a performance measurement. curl -w and the DevTools waterfall answer the first question of any slow experience — where does the time actually go? — with data instead of a guess. The stages you measured (DNS, connect, TLS, first byte, download) are exactly the levers you can pull: a slow DNS points at resolver configuration, a slow first byte points at the server or the network path, and a large download points at an unoptimized or uncached resource. Measuring before optimizing is the whole game, and these tools are how you measure.
Scalability
A single curl command inspects one request, but the same command scripted in a loop becomes a crude load probe, and the -w variables become a stream of measurements you can average. This is not a substitute for real load-testing tools, but it scales your understanding: the same request you debugged by hand can be fired a thousand times to see whether latency holds or the error rate climbs. The Network tab, meanwhile, scales your view of a single complex page, showing how request count and total transfer size grow as an application does — the raw ingredients of how well it will scale to more content and more users.
Cost
Many services, including hosted model endpoints, bill per request or per unit of data. Being able to see exactly which requests fire, how large they are, and how often they repeat is direct cost control: a runaway retry loop or a request fetching far more data than it needs is money leaking, and the Network tab makes the leak visible. Debugging with curl against free public test endpoints, rather than against a metered production service, also keeps the cost of learning at zero — which is exactly what this lesson’s lab does.
Alternatives: free, open source, and commercial
curl and browser Developer Tools will cover the vast majority of your inspection needs, but it is worth knowing the neighbouring tools and when each earns its place.
| Tool | Type | Best for | Cost |
|---|---|---|---|
curl | Free, open source | Scripting and reproducing any single request precisely | Free |
| Browser Developer Tools | Free, built in | Observing everything a real page does, with timing | Free |
| HTTPie | Free, open source | The same job as curl with friendlier syntax and colour | Free |
| Postman | Freemium (commercial) | Organizing, saving, and sharing many requests in a team | Free tier; paid plans |
| Wireshark | Free, open source | Inspecting raw packets below the HTTP layer | Free |
| mitmproxy | Free, open source | Watching all traffic from an app or phone as a proxy | Free |
HTTPie is a command-line HTTP client built for humans: http GET httpbin.org/headers Accept:application/json does what the earlier curl command did, with coloured, formatted output and a syntax that reads like the request itself. Choose it when you want readable ad-hoc requests at the terminal; choose curl when you want a command that is installed everywhere and scripts cleanly. Postman is a graphical application for building and saving requests into shareable collections, with environments for switching between servers; reach for it when you are exploring a large API as a team and want to keep a library of example requests, rather than retyping curl commands. Its trade-off is weight and a login where curl is instant and local.
Wireshark works a full layer below everything else here: it captures raw network packets, so it can show the individual TCP segments and the DNS queries themselves, not just the assembled HTTP messages. You reach for it rarely — when you suspect the problem is beneath HTTP, in the connection or the packets — and it is overkill for ordinary request debugging. mitmproxy sits between an application and the internet as a proxy and records every request that passes through, which makes it the tool of choice for seeing what a mobile app or a program you did not write is actually sending. Both are powerful and free; both are more than you need for the day-to-day work of reading a request and its response, which curl and Developer Tools handle completely.
Comparison with related concepts
| Concept A | Concept B | Key difference |
|---|---|---|
curl | Developer Tools Network tab | curl composes one request you control; the Network tab records every request a real page made |
curl | HTTPie | Same purpose; curl is ubiquitous and script-friendly, HTTPie is friendlier to read and type |
curl / DevTools | Wireshark | The former read assembled HTTP messages; Wireshark reads raw packets below HTTP |
| Traffic inspection | Automated testing | Inspection shows what happened once, now; testing asserts what must hold every time |
4xx status | 5xx status | 4xx means your request was wrong; 5xx means the server failed a valid request |
-I (headers only) | -v (verbose) | -I shows just the response headers; -v shows the whole request and response conversation |
When to use it — and when not to
Reach for curl the instant a request fails in code you wrote: reproduce it outside your program to learn whether the fault is yours or the server’s, then vary one thing at a time until the response changes. Reach for it whenever you need to confirm exactly what you are sending or receiving — a header, a body, a status, a redirect chain — because curl shows the literal bytes with nothing in between. And reach for it in scripts, where -w and -s and -o let you extract a single value like the status code for an automated check.
Reach for Developer Tools whenever the thing you are debugging is a real page in a real browser: a blank screen, a slow load, a form that will not submit, an image that will not appear. The Network tab shows you the one failed or slow request among the many, with the timing and headers to explain it, in the exact context the browser produced it. For anything a user experiences in a browser, it is the first place to look.
Know when to leave these tools in the box. They inspect one request, or one page’s requests, at one moment — they are not a monitoring system that watches production continuously, not a load test that proves behavior under stress, and not a fix in themselves. When you need to know that something keeps working for everyone over time, you need monitoring and automated tests, not a manual curl. And when the problem is genuinely below HTTP — in the packets, the connection, or the network hardware — descend to Wireshark rather than squinting at a curl trace. The professional habit is to inspect first to locate the problem precisely, then choose the right tool for the fix.
Knowledge check
Try these from memory before looking back:
- In the output of
curl -v, what do the lines beginning with>,<, and*each represent? - You request a URL and get back a
301. What doescurl -Ldo about it, and why would omitting it mislead you? - Walk the failed-request decision tree in order, naming what has failed at each gate: DNS, connection, TLS, status, body.
- An API call from your code returns
429. What does that status mean, and what is the appropriate response? - What is the essential difference between what
curlshows you and what the Developer Tools Network tab shows you?
Hands-on exercise
Time to inspect real traffic. In this exercise — worked through in full in the Day 21 lab directory — you will use curl against two public test servers, https://httpbin.org (a service that echoes requests and returns any status you ask for) and https://example.com, to see each part of a request and response and to read status codes deliberately. curl is preinstalled on macOS and Linux, so open your terminal and run each command.
First, see a full conversation, reading the connection notes as the networking stages:
curl -v https://example.comNext, follow a redirect to its real destination, printing headers only:
curl -IL https://httpbin.org/redirect/1Confirm exactly which headers you sent, using the echo endpoint:
curl -H "Accept: application/json" https://httpbin.org/headersRead a status code cleanly, throwing away the body:
curl -o /dev/null -s -w "HTTP %{http_code}\n" https://httpbin.org/status/404Measure where the time goes on a real request:
curl -o /dev/null -s -w "dns:%{time_namelookup} connect:%{time_connect} tls:%{time_appconnect} ttfb:%{time_starttransfer} total:%{time_total}\n" https://example.comExpected output
The commands print, respectively: a full verbose trace whose * lines show the host resolving, the connection opening, and the certificate verifying, ending in < HTTP/2 200; two status blocks for the redirect, a 302 with a location header followed by a 200; a small JSON object echoing back the Accept: application/json header you sent; the single line HTTP 404; and a timing line such as dns:0.003577 connect:0.015769 tls:0.034880 ttfb:0.048609 total:0.048788 (your numbers will differ). The lab’s expected-output/ directory holds a real captured run of every command.
Validate your work
You are done when you can check every box:
- You can point at the line in
curl -vthat shows the TLS certificate verifying. - You saw two status codes for the redirect and can explain why
-Lproduced the second. - The headers endpoint echoed back the
Acceptheader you set with-H. - You read
HTTP 404as the exact status of the deliberate not-found request. - You can name which stage (DNS, connect, TLS, or transfer) took the most time in your timing line.
Troubleshooting
curl: (6) Could not resolve host. DNS failed — usually a typo in the hostname or no internet connection. Check the URL and your connection; this is the first gate of the decision tree.- The redirect shows only one status block. You omitted
-L. Add it socurlfollows thelocationheader to the final response. /status/500returns502,503, or504instead of500. That is httpbin’s own gateway responding under load. Any5xxmakes the same teaching point: the failure is the server’s, not your request’s. Retry, or use/status/404for a deterministic code.- The timing numbers are all
0.000000. You are likely offline or hitting a cached local resolver; confirm you have network access and are requesting a real remote URL.
Common mistakes
- Stopping at a redirect. Reading a
301/302as “the server returned nothing.” It returned a forwarding address; use-Lto follow it. - Confusing
4xxand5xx. A4xxmeans fix your request (URL, auth, body); a5xxmeans the server failed. Rewriting your request to fix a5xx, or blaming the server for a4xx, both waste time. - Forgetting
-o /dev/nullwhen you only want the status or timing. Without it, the whole body prints and buries the one line you care about.
Practice assignment
Open the debugging worksheet in the starter directory of the Day 21 lab and complete it for real requests. Using curl, record three things: a full redirect chain you followed (the intermediate status and location, then the final status), the timing breakdown for a site of your choice with a sentence naming the slowest stage, and the status code that https://httpbin.org/status/503 returns. Then write one short paragraph diagnosing a failure of your own invention — pick a status code (401, 404, 429, or 500), state which gate of the decision tree it corresponds to, and describe the single next step you would take to fix it. Keep the worksheet; the reasoning it builds is the reasoning you will use every time a request misbehaves.
Extension challenge
Go one step further and reproduce a small end-to-end exchange, then watch it two ways. First, send a POST with a JSON body and read it echoed back:
curl -X POST -H "Content-Type: application/json" -d '{"day":21,"topic":"inspection"}' https://httpbin.org/postRead the response: httpbin returns an object whose json field contains exactly what you sent and whose headers field shows the Content-Type you set — proof that your method, header, and body all arrived as intended. Now open your browser’s Developer Tools, go to the Network tab, and load any web page; find a single Fetch/XHR request, click it, and locate the same parts you just controlled by hand — the request method, the headers, the response body, and the Timing sub-tab with its DNS, connect, TLS, and waiting phases. Seeing that the row in the Network tab and the curl command describe the same request from two angles is the moment the whole networking category clicks into place: the request you traced in theory across seven lessons is a concrete, inspectable object, and you now have the tools to see it. This capstone feeds directly into the category project, the Request Journey Map, where you will document a single real request from address lookup to rendered pixels using exactly these instruments.
Quiz
Q1. In the output of `curl -v`, what do lines beginning with `>` represent?
- The response headers the server returned
- The request headers curl sent to the server
- curl's own notes about resolving and connecting
- The body of the downloaded page
Show answer
Answer: B. The request headers curl sent to the server
In verbose output, `>` marks the request curl sent, `<` marks the response headers that came back, and `*` marks connection notes (DNS, TCP, TLS). Reading the three prefixes separately is the core skill of a verbose trace.
Q2. You request a URL and get back a `302`. What does adding `-L` do?
- It prints the response body instead of only the headers
- It retries the request until the server returns a 200
- It follows the redirect in the location header to the final destination
- It logs the request to a file for later inspection
Show answer
Answer: C. It follows the redirect in the location header to the final destination
A `301`/`302` is a forwarding address, not the final answer. `-L` tells curl to follow the `location` header to the real destination; without it you stop at the redirect and may wrongly conclude the endpoint returned nothing.
Q3. An API call from your code returns `429 Too Many Requests`. What does it mean?
- The server crashed while handling your valid request
- The URL does not exist on the server
- Your credentials are missing or invalid
- You are sending requests too fast and should slow down or back off
Show answer
Answer: D. You are sending requests too fast and should slow down or back off
`429` is a `4xx` client error meaning you have exceeded a rate limit. The fix is on your side: reduce request frequency or add a back-off delay, not rewrite the server or the endpoint.
Q4. Which flag makes curl print only the response headers using a HEAD request?
- `-I`
- `-d`
- `-X`
- `-o`
Show answer
Answer: A. `-I`
`-I` fetches headers only (a HEAD request) and prints the status line and response headers without downloading the body — useful for checking status and headers quickly.
Q5. In the failed-request decision tree, what does a `5xx` status code tell you compared with a `4xx`?
- `5xx` means DNS failed; `4xx` means TLS failed
- `5xx` means the server failed handling a valid request; `4xx` means your request was wrong
- `5xx` is always a temporary problem; `4xx` is always permanent
- They mean the same thing and can be treated identically
Show answer
Answer: B. `5xx` means the server failed handling a valid request; `4xx` means your request was wrong
A `4xx` means the client sent something wrong — bad URL, missing authentication, malformed body — so fix your request. A `5xx` means the server erred on a request it accepted. Blaming the wrong side wastes debugging time.
Q6. Which curl option lets you print a custom value such as the status code after a transfer?
- `-s`
- `-H`
- `-w`
- `-L`
Show answer
Answer: C. `-w`
`-w` (write-out) prints chosen variables after the transfer, such as `%{http_code}` for the status or timing variables like `%{time_total}`. Combined with `-o /dev/null` and `-s`, it extracts just the value you want.
Q7. In the Developer Tools Network tab, which filter shows only the API calls a page made?
- The `Img` filter
- The `CSS` filter
- The `Doc` filter
- The `Fetch/XHR` filter
Show answer
Answer: D. The `Fetch/XHR` filter
The `Fetch/XHR` type filter hides documents, scripts, styles, and images, leaving only the background data requests (the API calls) so you can focus on the request you are debugging.
Q8. When would you reach for Wireshark instead of curl or the Network tab?
- When you want to save and share a collection of requests with a team
- When you suspect the problem is below HTTP, in the raw packets or the connection itself
- When you want friendlier, coloured output for an ad-hoc request
- When you need to follow a redirect to its final destination
Show answer
Answer: B. When you suspect the problem is below HTTP, in the raw packets or the connection itself
Wireshark captures raw network packets, a full layer below the assembled HTTP messages that curl and the Network tab read. You reach for it in the rarer cases where the fault is beneath HTTP — in the TCP segments, the DNS queries, or the connection.
Glossary
- curl
- A command-line program that makes a single HTTP request you describe and prints the response, giving you precise control over and full visibility into one exchange.
- verbose mode
- curl's `-v` option, which prints the entire conversation: the request sent (lines starting with >), the response headers (lines starting with <), and connection notes (lines starting with *).
- header
- A named field of metadata attached to an HTTP request or response, such as Accept, Content-Type, or Authorization, that carries information alongside the body.
- redirect
- A response (status 301 or 302) that points the client to a different URL via a location header rather than returning the content directly; `curl -L` follows it to the final destination.
- DevTools
- A browser's built-in Developer Tools: a panel for inspecting a page's structure, console, performance, and network activity, opened with F12 or Command-Option-I.
- Network tab
- The Developer Tools panel that records every request a page makes, showing each one's status, type, size, timing, and full headers and body.
- waterfall
- A timeline view in the Network tab where each request is a horizontal bar showing when it started and how long each phase took, making slow or late requests easy to spot.
- payload
- The body of a request or response — the actual data being sent or returned — as distinct from the headers that describe it.
- User-Agent
- A request header identifying the client software making the request; curl sends a value like `curl/8.7.1`, while a browser sends a long string naming itself and its version.
- httpie
- A free, open-source command-line HTTP client, an alternative to curl designed for human readability with coloured, formatted output and a simpler syntax.
- proxy
- An intermediary that sits between a client and a server and relays their traffic; a debugging proxy such as mitmproxy records every request that passes through it, revealing what an application is sending.
- status code
- A three-digit number in an HTTP response signalling the outcome: 2xx success, 3xx redirection, 4xx a client (request) error, and 5xx a server error.
- time to first byte
- The elapsed time from sending a request to receiving the first byte of the response, reported by curl as `time_starttransfer` and by the Network tab in a request's Timing sub-tab.
Sources and further reading
- curl Documentation — curl / Daniel Stenberg (accessed 2026-07-12) — The official documentation for curl, including the manual page for every flag used in this lesson.
- Everything curl — Daniel Stenberg (accessed 2026-07-12) — The book-length, freely available guide to curl and libcurl by its lead developer.
- Inspect network activity — Chrome DevTools — Google (accessed 2026-07-12) — Official reference for the Network tab: columns, filters, timing, and the waterfall.
- HTTP overview — MDN Web Docs (accessed 2026-07-12) — Background on HTTP messages, methods, headers, and status codes.
- httpbin — HTTP Request & Response Service — Kenneth Reitz (accessed 2026-07-12) — The public test service the lab uses to echo requests and return chosen status codes.
Kept in this browser, no account needed. Your progress page turns the whole record into one link you can bookmark or open on another device.