Math, Statistics, and Data › pandas and Data Wrangling › Day 120
Day 120: pandas: Series and DataFrames
After this lesson you will be able to build a pandas Series and a DataFrame three different ways and say correctly what the index becomes each time; predict, before running it, exactly which labels go NaN when two Series with partially overlapping indexes are added, because you understand that pandas aligns on label rather than position; state the pandas 3.0 default dtype for a column of strings and demonstrate why it differs from the object dtype almost all existing tutorials describe; show precisely why chained assignment leaves a DataFrame completely unchanged under pandas 3.0's unconditional Copy-on-Write, and write the single .loc statement that performs the assignment correctly; state and demonstrate the exact endpoint asymmetry between .loc (label-based, inclusive of its stop) and .iloc (positional, exclusive of its stop); explain why comparing a Series against NaN with == can never find a missing value and use .isna() instead; measure vectorised arithmetic against .apply with a lambda and report the gap honestly, as a ratio and a shape rather than a timing; declare an integer column that might ever meet a missing value as the nullable Int64 dtype rather than int64, and say exactly what precision loss that avoids; and read .describe(), .info(), .head() and memory_usage(deep=True) as the four commands you run on any frame you have not met before.
Hands-on lab for this lesson
Lab files on GitHub: https://github.com/ai-roadmap-365/ai-roadmap-365.github.io/tree/main/labs/sections/math-statistics-and-data/day-120-pandas-series-and-dataframes
- Get the hands-on files. Clone the labs repository once (you can reuse this clone for every lesson). This works on macOS, Linux, and Windows (PowerShell or WSL):
git clone https://github.com/ai-roadmap-365/ai-roadmap-365.github.io.git cd ai-roadmap-365.github.io - Open this lesson's lab. Move into the directory for this specific day. Every lab lives at the same predictable path — section / subsection / week / day:
cd labs/sections/math-statistics-and-data/day-120-pandas-series-and-dataframes - Read the lab guide. Open `README.md` in that directory. It lists the exact commands, what each does, the expected output, and how to check your work — read it before running anything.
- Run it and check your work. Follow the README's "How to run" section: run the example first to see the finished result, then complete the numbered exercises in `starter/`, then run the tests. The tests pass (exit 0) only when your work is correct.
bash tests/run_tests.sh # or the test command named in the lab README
You can also open the lab as a local page (works offline, shows the file tree and expected output).
Learning objectives
By the end of this lesson you will be able to:
- Build a Series and a DataFrame from a dict, from records, and from a bare NumPy array, and state correctly what the index becomes in each case
- Predict exactly which labels go NaN when two Series with partially overlapping indexes are added, and explain why pandas aligns on label rather than position
- Opt out of index alignment deliberately with .to_numpy() or .reset_index(drop=True), and say when each is the right choice
- State the pandas 3.0 default string dtype (str) and demonstrate how it differs from the pre-3.0 object default, including for memory_usage(deep=True)
- Demonstrate that an int64 column silently promotes to float64 the moment a missing value enters it, losing exact precision past 2**53, and use the nullable Int64 dtype to prevent it
- Show that chained assignment leaves a DataFrame unchanged under pandas 3.0's unconditional Copy-on-Write, name the ChainedAssignmentError warning it raises, and write the single .loc statement that performs the assignment correctly
- State the exact endpoint difference between .loc (label-based, inclusive of the stop) and .iloc (positional, exclusive of the stop), and predict which rows a given slice returns before running it
- Explain why comparing a Series against NaN with == always returns False and use .isna() as the reliable test instead
- Measure vectorised arithmetic against .apply(lambda ...) on the same column and report the result as a ratio and a shape, never a millisecond figure
- Read .describe(), .info(), .head() and memory_usage(deep=True) as the four commands to run on any new frame, and check .describe()'s numbers against hand computation from Day 116
- Explain how a DataFrame differs from a NumPy array (Day 104), a SQL table (Week 13), and a polars DataFrame, specifically regarding the index
- Trace how a silent index-alignment NaN, buried by a downstream fillna(0), can corrupt a machine-learning feature column without raising any error
Prerequisites
- Day 104 — NumPy arrays, dtypes, shape and vectorised thinking; a Series is an ndarray with an index bolted on
- Day 116 — descriptive statistics computed by hand, including Bessel's correction, which .describe() reproduces exactly
- Days 92-98 — data formats and pipelines, and the habit of reading data before trusting it
- Week 13 — SQL and SQLite, the tool this lesson compares pandas against for tabular questions that do not fit in memory
- A working python3 on your PATH; the lab creates its own virtual environment with pandas 3.0.5 pinned exactly
Why this matters
Run this on pandas 3.0.5 — the version this whole lesson is written against — and read it twice before moving on:
>>> x = pd.Series([1, 2, 3], index=["a", "b", "c"])
>>> y = pd.Series([10, 20, 30], index=["b", "c", "d"])
>>> x + y
a     NaN
b    12.0
c    23.0
d     NaN
dtype: float64
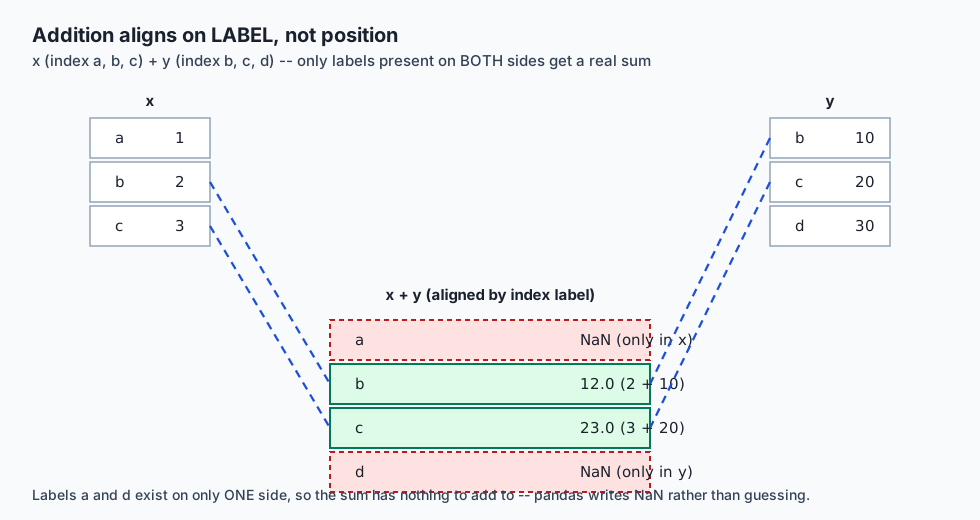
Nothing errored. Nothing warned. x + y ran, returned a Series, and every value in it looks plausible. And it is not the sum most people expect the first time they see this: not [11, 22, 33], the answer you would get adding two same-length lists position by position. Two of the four labels came back NaN — not because anything is broken, but because pandas refused to guess. Label a exists only in x. Label d exists only in y. There is no partner to add to, so pandas writes “I don’t know” instead of silently picking a wrong number.
That is the entire subject of this lesson, and it is worth being blunt about why it is dangerous rather than merely surprising. A DataFrame is not a spreadsheet of cells sitting at fixed positions. It is a set of Series that agree on one index, and every arithmetic operation between two of them asks first: do our labels match? When they do, you get the sum you expect. When they do not — because one Series came from a filtered subset, a differently sorted query result, or a join that dropped a few rows — you get NaN in exactly the positions where the labels disagree, and the operation still “succeeds”. No exception. No red text. A column that looks complete, with some plausible-looking gaps, silently contaminated by an index mismatch nobody checked for.
This is the lesson pandas explains badly to almost everyone who learns it from documentation alone, because the documentation is written for people who already trust the index. You do not, yet, and you should not until you have watched it fail once on purpose — which is exactly what the animated diagram below does, and what the first exercise in this lab does immediately after it.
Two more things make this day worth its own lesson rather than a footnote on Day 104’s NumPy arrays. First: pandas 3.0, released in 2025, changed two load-bearing defaults that almost every tutorial, book, and Stack Overflow answer written before it still gets wrong — Copy-on-Write is now unconditional, and the default dtype for a column of text is str, not object. If you learned pandas from material written before 2025, you have exactly the wrong mental model for both, and this lesson corrects both from real, captured runs on 3.0.5 rather than from memory of an older version. Second: every machine-learning pipeline you will ever build starts with a DataFrame, and the index-alignment behaviour above is one of the quietest ways a feature set gets corrupted before a model ever sees it. A join on mismatched keys, an arithmetic operation between two columns computed from differently filtered subsets, a merge that silently drops rows — all of them produce NaN, and the very next line in most pipelines is .fillna(0), which buries the evidence permanently. By the end of today you will know exactly why that happens and how to check for it before it happens to you.
The idea in plain language
Here is the plain version, with no code yet.
A Series is a column: a list of values, and beside every value, a label. The labels together are called the index. pandas.Series([10, 20, 30]) gives you three values with the default labels 0, 1, 2 — but you can label them anything: "a", "b", "c", dates, product codes, whatever identifies each row in your problem.
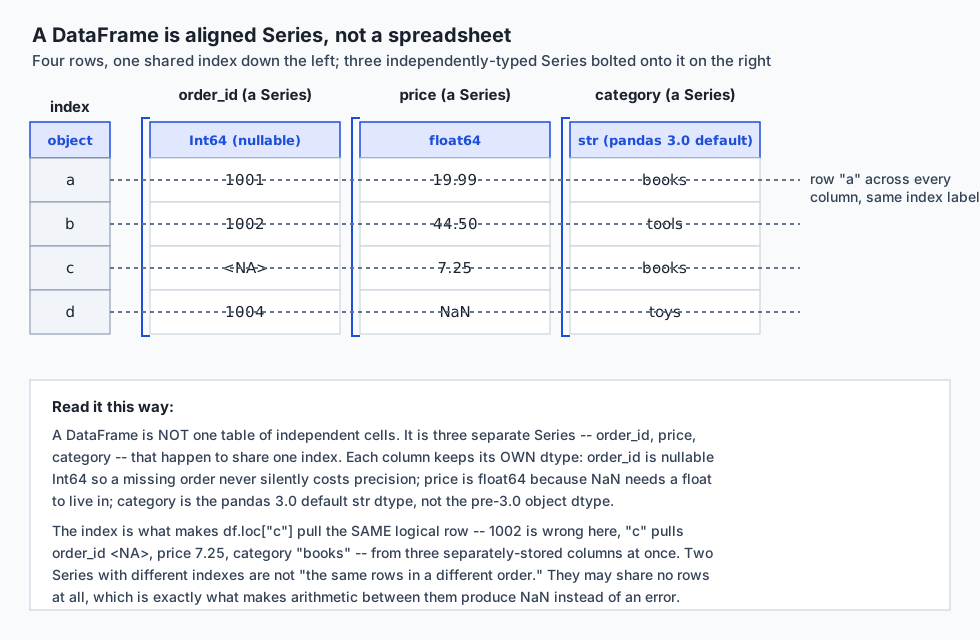
A DataFrame is a table: several Series, laid side by side, that all share the same index. Picture a spreadsheet where the row labels down the left are shared by every column to the right — that sharing is not decoration, it is the mechanism that makes df.loc["c"] pull the right row out of every column at once. Look at the architecture diagram below: three differently-typed columns — order_id, price, category — sit beside one shared index running a, b, c, d. Each column is its own independent Series with its own dtype. What ties them into one table is that they all answer to the same four labels.
Now the part that catches everyone once: because the index is a real, checked identity — not just a row number — arithmetic between two Series does not assume they line up. It checks. Here is the animated version of the opening example: x, labelled a, b, c, slides in from the left; y, labelled b, c, d, slides in from the right; they converge on the shared labels in the middle. Labels b and c exist on both sides, so they light up and add for real: 2 + 10 = 12, 3 + 20 = 23. Labels a and d exist on only one side each, so nothing arrives to add to them, and the result is NaN.
The everyday-analogy section below carries this further, but the short version: think of the index as a name tag, not a seat number. Two guest lists merge correctly when you match people by name tag even if the lists are in different orders; they merge into nonsense if you insist on matching by seat number when the seating changed between lists. A NumPy array — Day 104’s subject — only has seat numbers. A Series has name tags. That one addition is the entire difference, and it is both the reason pandas exists and the reason it can lie to you quietly if you forget it is there.
Historical background
pandas began at AQR Capital Management, a quantitative hedge fund, where Wes McKinney started writing it in 2008 because the tools available in Python at the time — mostly bare NumPy arrays and hand-rolled dictionaries — had no good way to represent labelled, heterogeneous tabular data the way R’s data.frame did. McKinney open-sourced the library in 2009, and the name is a contraction of “panel data”, the econometrics term for datasets that track multiple entities over multiple time periods — exactly the shape of the financial time series pandas was built to analyse.
The library’s first major public milestone was version 0.1 in January 2011. Growth was fast: pandas became, alongside NumPy and later scikit-learn, one of the three libraries that defined what “doing data science in Python” meant through the 2010s, displacing a great deal of R-based analysis work along the way specifically because it combined R’s labelled-data ergonomics with Python’s general-purpose ecosystem.
Version 1.0, a genuine 1.0 rather than a marketing bump, arrived in January 2020 — more than a decade after the project started, reflecting how conservatively the maintainers treated API stability once the library had become foundational infrastructure for an enormous number of other projects.
The two changes this lesson is built around both belong to pandas 2.0, released in April 2023, and pandas 3.0, released in 2025. Version 2.0 introduced an optional Copy-on-Write mode and made PyArrow — the Python bindings for the Apache Arrow project’s columnar memory format — an available backend for several dtypes, including a dedicated string type. Version 3.0 made both of those changes non-optional: Copy-on-Write became the only behaviour, with no switch to turn it off, and the PyArrow-backed str dtype became the default for columns of text, retiring object from that role after roughly fifteen years as the default. The version installed for this lesson, checked directly rather than assumed, is:
>>> import pandas; pandas.__version__
'3.0.5'
Everything below that depends on this specific behaviour says so explicitly, because a reader arriving from pandas 2.x documentation — which still describes the optional Copy-on-Write and the object string default — is not wrong about the pandas they learned. They are describing an earlier, real, and reasonable version of the library. expected-output/FIELDS.md in this lesson’s lab lists every value that would print differently there.
What it is — and what it is not
pandas is a Python library for representing, manipulating and analysing tabular and one-dimensional labelled data, built on top of NumPy’s arrays and, since pandas 2.0, optionally on PyArrow’s columnar format as well. Its two central data structures are the Series (one labelled column) and the DataFrame (several Series sharing one index, i.e. a labelled table).
It is not a spreadsheet, even though it is usually explained by comparison to one. A spreadsheet cell is addressed by a fixed grid position (B7) and formulas recalculate automatically when a referenced cell changes. A DataFrame cell is addressed by a label on each axis, arithmetic between two DataFrames or Series aligns by those labels before computing anything, and nothing recalculates automatically — every operation produces a new object (or, since pandas 3.0’s Copy-on-Write, at minimum a defensively-shared one) rather than propagating a live formula graph.
It is not a database, though it borrows vocabulary from one — .merge() reads like a SQL join because it is one. pandas holds its data in memory, has no transaction log, no concurrent-writer story, and no query planner; when the data does not fit in memory or multiple processes need to write at once, that is the point where Week 13’s SQL is the better tool, covered explicitly in the Alternatives section below.
It is not NumPy, even though every Series wraps something extremely close to a NumPy array underneath (or, since 2.0, a PyArrow array for certain dtypes). The difference that matters today is the index: a bare numpy.ndarray addresses its elements purely by integer position, with no concept of a label at all. A pandas Series adds exactly one thing on top of that array — a parallel array of labels — and that one addition is what makes every idea in this lesson possible and every mistake in this lesson dangerous.
It is, specifically, the library that made “the index is meaningful” the default assumption for tabular data in Python. Every misconception this lesson corrects is a misconception about that one design choice: that arithmetic is positional (it is label-based), that a string column has no real dtype worth knowing (as of 3.0, it does), and that “a copy” and “a view” are interchangeable ideas (Copy-on-Write exists specifically because they are not).
Why it was created and what problems it solves
Before pandas, doing what this lesson calls “loading a table and asking it a question” in Python meant one of three unpleasant choices. You could use bare NumPy arrays, which have no labels, no heterogeneous columns (every element of an array shares one dtype), and no native missing-value handling — modelling a table of mixed types meant either a structured array with fragile, verbose syntax, or parallel arrays you kept in sync by hand. You could use the standard library’s csv module and plain Python dictionaries, which handle heterogeneity fine but give you nothing for vectorised computation — every operation is a Python-level loop, with all the overhead Day 104 measured. Or you could reach outside Python entirely, into R, which had data.frame and vectorised, labelled operations built in from the start, but which meant leaving Python’s general-purpose ecosystem to do the one part of your work that happened to be tabular.
pandas exists to close that gap: bring R’s data.frame ergonomics — labelled axes, heterogeneous columns, built-in missing-value handling, vectorised operations, and a rich set of reshaping, grouping and joining verbs — into a library built on NumPy, so tabular work and numerical work could live in the same process, the same memory, and the same ecosystem.
The specific problem index alignment solves, concretely: before you can trust that adding two columns produces the right answer, you need some guarantee that the two columns’ rows correspond to the same real-world entities in the same order. A bare NumPy array offers no such guarantee — row 5 of one array and row 5 of another are “the same row” only if you, personally, kept them in sync through every filter, sort, and join along the way, and a single dropped row anywhere upstream silently shifts every row after it. pandas’ answer is to make the correspondence explicit and checked: every Series carries its own labels, and every binary operation verifies those labels line up — asking the question a NumPy array cannot even represent, let alone answer.
The dtype problems this lesson covers — int64 silently promoting to float64, and the pre-3.0 object string tax — both trace back to the same root cause: NumPy’s arrays require one fixed, homogeneous, fixed-width type per array, and real tabular data is full of things that do not fit that mould cleanly — missing values in what should be a whole-number column, text of varying length, mixtures of types within one column. pandas’ entire dtype system, including the newer nullable types like Int64 and the PyArrow-backed str, exists to give you more precise, more honest answers to “what kind of thing is actually in this column” than a bare NumPy array can express on its own.
How it works
Building a Series and a DataFrame, three ways
The cleanest way to see what the index actually is — rather than trust a description of it — is to watch it get built three different ways and notice what determines it each time.
From a dict, the keys become the index, in insertion order:
>>> pd.Series({"a": 10, "b": 20, "c": 30})
a    10
b    20
c    30
dtype: int64
From a dict of lists, building a DataFrame, the dict’s keys become column names — but nothing in that construction says anything about row labels, so pandas falls back to the default RangeIndex, 0, 1, 2, ...:
>>> pd.DataFrame({"x": [1, 2, 3], "y": [4.0, 5.0, 6.0]})
   x    y
0  1  4.0
1  2  5.0
2  3  6.0
A list of records — one dict per row, the shape you get back from a JSON API or a database cursor — produces an identical result, because a “record” is just the row-oriented way of writing the same table pandas just built column-oriented above; pandas transposes it for you.
From a bare NumPy array, there is no label information anywhere in the input at all — an ndarray has no concept of a label, as the previous section established — so you must supply both the index and the column names yourself, or accept the same RangeIndex default on both axes:
>>> arr = np.array([[1, 2], [3, 4], [5, 6]])
>>> pd.DataFrame(arr, index=["p", "q", "r"], columns=["c1", "c2"])
   c1  c2
p   1   2
q   3   4
r   5   6
Captured directly from examples/01_three_ways_to_build.py in this lesson’s lab, on pandas 3.0.5 — every one of these results, and the dtype of every column, is asserted rather than assumed.
Automatic alignment
The mechanism behind the opening example is worth stating with total precision, because “aligns the indexes” undersells what actually happens. When you write x + y for two Series, pandas computes the union of the two indexes, reindexes both Series onto that union (filling with NaN wherever a label is missing from one side), and only then adds them elementwise, position by position, on the now-identical, now-aligned indexes. It is never a positional add followed by a label check — the alignment happens first, unconditionally, on every arithmetic operator (+, -, *, /, comparisons), every time, whether or not the two Series happen to already share an index.
That “whether or not” clause is the entire danger. If both operands already have identical, same-order indexes — the common case when both columns came from the same DataFrame — alignment is invisible, because there is nothing to align; the result looks exactly like a positional operation would have. The behaviour only becomes visible, and only becomes dangerous, the moment the two indexes genuinely differ — which is exactly the moment nobody is watching for it, because the code “always worked before”.
Opting out, when a positional operation is genuinely what you want, has two clean forms. .to_numpy() (or the older .values) strips a Series down to its underlying array, discarding the labels entirely, so + on two .to_numpy() results is ordinary NumPy positional addition:
>>> x.to_numpy() + y.to_numpy()
array([11, 22, 33])
.reset_index(drop=True) takes a different route to the same destination: it keeps both operands as Series, but replaces their existing labels with a fresh RangeIndex, so the labels now agree by construction and alignment happens to coincide with position. The right choice between the two depends on what you need afterward: reach for .to_numpy() when you are about to hand the result to something that wants a plain array anyway (NumPy, a plotting call, a model’s .predict()); reach for .reset_index(drop=True) when you need to keep working with labelled Series or DataFrames downstream and simply know, for this one operation, that the rows genuinely correspond positionally rather than by any meaningful label.
dtypes, and the moment an integer column stops being one
Every Series has exactly one dtype, describing what every value in it is. int64 and float64 are the ordinary NumPy numeric types Day 104 covered; bool is a boolean array; and, as of pandas 3.0, str is the default dtype for a column built from Python strings — not object:
>>> pd.Series(["a", "b"]).dtype
str
On any pandas release before 3.0, that same line prints object — a column of pointers to separately-allocated Python string objects scattered across memory, with none of the contiguous-storage benefits Day 104 covered for numeric arrays. pandas 3.0’s str dtype, built on PyArrow, stores the string data contiguously instead, and the difference shows up directly in a place almost nobody checks: .memory_usage(deep=True). For a legacy object column, deep=True reports substantially more bytes than the shallow estimate, because the shallow count only sees the pointers and deep=True is the only way to see what they point to. For the pandas-3.0 str dtype, on the same data, deep=True and deep=False report the identical number, because there is no pointer indirection left for “deep” to discover:
deep=False | deep=True | |
|---|---|---|
pandas-3.0 str column, 8 short values | 72 bytes | 72 bytes (no difference) |
the same data forced to legacy object | 64 bytes | 400 bytes (6.25x more) |
Captured from examples/09_describe_known_column.py. object still exists and is still what a genuinely mixed-type column gets — pd.Series(["a", 1, 3.5]) is still object, on any pandas version — and you can still request it explicitly with dtype="object" if some downstream code depends on the old behaviour. It is simply no longer the default for a column that is actually just text.
Now the trap that costs real precision. NumPy’s int64 has no bit pattern reserved for “missing”. The moment a genuinely missing value enters what was an int64 Series — through a reindex() onto a label that never existed, a failed join, or an explicit assignment of NaN — pandas has nowhere to put it inside int64, so it silently rebuilds the entire column as float64, which does have a bit pattern for NaN:
>>> ids = pd.Series([1001, 1002, 1003], dtype="int64")
>>> ids.reindex([0, 1, 2, 3])
0    1001.0
1    1002.0
2    1003.0
3       NaN
dtype: float64
Every value in that column — not just the missing one — is now a float. That matters beyond cosmetics: float64 has a 53-bit mantissa, so it can represent every integer up to 2**53 exactly, but not beyond. Push an ID past that boundary through the same promotion and it silently rounds:
>>> big_id = 2**53 + 1              # 9007199254740993
>>> pd.Series([big_id], dtype="int64").reindex([0, 1]).iloc[0]
9007199254740992.0                  # off by one, silently
This is precisely the failure mode an ID column is supposed to be immune to — nobody does arithmetic on an order ID, and nobody expects it to lose precision, because “it’s just an integer” is the entire reason it was declared int64 in the first place. The fix is the nullable Int64 dtype (capital I, deliberately distinct from lowercase int64), which stays in the integer family and represents a missing value as pd.NA instead of borrowing NaN from the float world:
>>> pd.Series([1001, 1002, 1003], dtype="Int64").reindex([0, 1, 2, 3])
0    1001
1    1002
2    1003
3    <NA>
dtype: Int64
>>> pd.Series([big_id], dtype="Int64").reindex([0, 1]).iloc[0]
9007199254740993                    # exact
Captured from examples/03_dtype_promotion.py. The rule worth carrying forward: any integer column that might ever meet a missing value — which, in practice, is any integer column that will ever be joined, reindexed, or merged — should be declared Int64 from the start, not int64, unless you have specifically confirmed it can never encounter a gap.
Copy-on-Write and chained assignment
This is the section to read slowest, because it corrects the single most common wrong belief carried in from older pandas material, and getting it wrong corrupts data with no error message at all.
pandas 3.0 has Copy-on-Write permanently on. There is no longer a setting to turn it off. The direct, practical consequence is about chained assignment — writing two indexing operations back to back in one statement, such as df[df["a"] > 1]["b"] = 0. Read that statement as pandas actually executes it: df[df["a"] > 1] is evaluated first, on its own, and produces a new, temporary DataFrame holding the filtered rows. The ["b"] = 0 that follows then assigns into that temporary — which is immediately discarded, having been created for no purpose but to be thrown away. The original df is never touched.
Run it, on pandas 3.0.5, and read the output carefully:
>>> df = pd.DataFrame({"a": [1, 2, 3], "b": [10, 20, 30]})
>>> df["b"].tolist()
[10, 20, 30]
>>> df[df["a"] > 1]["b"] = 0
ChainedAssignmentError: A value is being set on a copy of a DataFrame or
Series through chained assignment.
Such chained assignment never works to update the original DataFrame or
Series, because the intermediate object on which we are setting values
always behaves as a copy (due to Copy-on-Write).
Try using '.loc[row_indexer, col_indexer] = value' instead, to perform the
assignment in a single step.
>>> df["b"].tolist()
[10, 20, 30]
Two things are true at once here, and both matter. The frame is completely unchanged — this is the correction to the strongest wrong assumption people carry in: it is not that the assignment “sometimes doesn’t work” or “works but triggers a slow copy”; on pandas 3.0.5, chained assignment against a mismatched selection cannot work at all, structurally, no matter what the data looks like. And, separately: pandas 3.0.5 does warn about it, with a class called ChainedAssignmentError that is, despite its name, a Warning subclass rather than a raised exception — the statement still “completes” and execution moves on to the next line, which is exactly why the warning is easy to miss if your environment filters or redirects warnings, or if the statement sits inside a function whose return value nobody checks. This is a real, useful improvement over the pre-3.0 story, where the equivalent situation sometimes raised an inconsistent SettingWithCopyWarning and sometimes said nothing at all, depending on internal memory layout that was never part of any documented guarantee — but it is still a warning, not a hard failure, and a reader who has learned to ignore pandas warnings will walk straight past the one warning in this entire lesson that is trying to save their data.
The fix is one statement instead of two: a single .loc call that names both the row selector and the column selector together, so there is only ever one object involved — no temporary to lose the write to:
>>> df.loc[df["a"] > 1, "b"] = 0
>>> df["b"].tolist()
[10, 0, 0]
That is the entire rule. Any assignment that reads as two separate square-bracket lookups chained together — df[mask][col] = value, df[col][mask] = value, df.iloc[0]["b"] = value — is chained assignment and will not reliably write to the original object, regardless of whether pandas happens to warn about the specific form you used. Any assignment that is one .loc[...] or .iloc[...] call carrying both selectors at once will.
One more piece completes the picture. Some material — including, honestly, drafts of this very lesson before it was checked against a real pandas 3.0.5 install — describes Copy-on-Write as something you toggle with pd.options.mode.copy_on_write. On 3.0.5, setting that option no longer does anything except warn that it no longer does anything:
>>> pd.options.mode.copy_on_write = False
Pandas4Warning: The 'mode.copy_on_write' option is deprecated. Copy-on-Write
can no longer be disabled (it is always enabled with pandas >= 3.0), and
setting the option has no impact. This option will be removed in pandas 4.0.
Captured from examples/04_copy_on_write.py, which is, deliberately, exercise 4 in this lesson’s lab — this is the day’s single most important check, and it asserts every line above against the real values, not a description of them.
Selection: [], .loc, .iloc
Three ways to pull data out of a Series or DataFrame, and the two that matter most disagree about something that surprises everyone exactly once.
Plain square brackets, df["col"] or df[["col1", "col2"]], select columns by name on a DataFrame, and select elements by label on a Series. df[boolean_mask] selects rows — a different axis entirely, decided by whether the thing inside the brackets is a column name, a list of names, or a boolean array. This overloading is exactly why chained assignment above is so easy to write by accident: df[mask] already reads naturally as “the rows I want”, so appending ["b"] = 0 feels like the obvious next step.
.loc and .iloc exist specifically to be unambiguous about which axis and which kind of addressing you mean. .loc[row_selector, column_selector] is label-based on both axes. .iloc[row_selector, column_selector] is positional on both axes, exactly like indexing a plain Python list or a NumPy array. Used with a single value or a list, they behave the way most people expect. Used with a slice, they diverge in a way that is easy to overlook because, on the surface, they can look like they agree:
>>> df = pd.DataFrame({"val": [10, 20, 30, 40, 50]}, index=["a", "b", "c", "d", "e"])
>>> df.loc["b":"d"]
   val
b   20
c   30
d   40
>>> df.iloc[1:4]
   val
b   20
c   30
d   40
Both return the same three rows — but notice the stop values are different numbers: "d" for .loc, 4 for .iloc. That difference is the whole rule, stated precisely: .loc’s stop is a label to include; .iloc’s stop is a position to stop before. .loc["b":"d"] means “everything from b through d, d included” — the label-based, natural-language reading of a range. .iloc[1:4] means “everything from position 1 up to, but not including, position 4” — the same half-open-interval convention every Python slice uses.
The asymmetry only becomes visible, and only becomes dangerous, when you write the “matching” stop number instead of the corresponding one — which is exactly the mistake a reader coming from .loc["b":"d"] is likely to make, because 3 is where "d" lives:
>>> df.iloc[1:3]
   val
b   20
c   30
One row shorter. "d" sits at position 3, and .iloc’s slice stops before position 3 — so the label that .loc["b":"d"] deliberately included is the exact label .iloc[1:3] silently drops, even though 3 is that label’s own position. Getting the same three rows out of both requires writing a different stop number on purpose — 4, one past "d"’s position — not the number that looks like it corresponds.
NaN semantics
NaN follows the IEEE 754 floating-point standard, and one property of that standard trips up more code than almost anything else in numerical Python: NaN is never equal to anything, including itself.
>>> float("nan") != float("nan")
True
This is not a pandas quirk — it is inherited straight from IEEE 754, the same standard Day 70 covered for floating-point representation generally — but pandas’ missing-value story rests on it directly. Because NaN == NaN is False, comparing a Series against NaN with == can never find a missing value, no matter how many are actually present:
>>> s = pd.Series([1.0, np.nan, 3.0])
>>> s == np.nan
0    False
1    False
2    False
dtype: bool
Every entry reads False — including position 1, which is the missing value the comparison was trying to find. This is exactly why .isna() exists as a dedicated method rather than something you are expected to reconstruct from ==: it does not rely on equality at all, checking instead whether the underlying storage marks a position as missing:
>>> s.isna()
0    False
1     True
2    False
dtype: bool
None and NaN differ depending on the surrounding dtype, and the difference is worth knowing precisely rather than approximately. Inserted into a numeric column, None is converted to the float NaN on entry — pd.Series([1, None, 3]) becomes float64 with a real NaN at position 1, following the same int-to-float promotion rule from the dtype section above. Inserted into a pandas-3.0 str column, None is stored differently under the hood, but .isna() finds it exactly as reliably either way — the whole point of .isna() is that you never need to know or care which specific missing-value representation a given dtype happens to use internally.
Vectorisation, revisited
Day 104 established the core idea: NumPy operations move the loop from CPython’s interpreted bytecode into compiled C, and .apply(lambda x: ...) on a pandas Series does the opposite — it calls a real Python function once per row, from Python, paying interpreter overhead on every single element. The same comparison, run directly on a pandas Series rather than a bare array, on 200,000 rows of random prices:
>>> (df["price"] * 1.08).equals             # vectorised
>>> df["price"].apply(lambda x: x * 1.08)   # one Python call per row
measured a ratio of roughly 250x — vectorised arithmetic against .apply with a lambda, on identical input, on one Apple Silicon machine, on one day. That number is reported as a ratio and a shape — “at least 20x faster, on 200,000 rows” — rather than a millisecond figure, because a millisecond figure is a fact about this one machine on this one day and would mislead if quoted any more precisely than that; the lab’s test asserts the ratio clears 20x, a bar comfortably below what this run measured, precisely so the assertion holds on hardware slower or faster than the one it was authored on.
The four commands you run on any new frame
.describe() computes the exact summary statistics Day 116 taught by hand — count, mean, standard deviation, the quartiles, min, max — over every numeric column at once. On the fixed column [2, 4, 4, 4, 5, 5, 7, 9]:
>>> pd.Series([2, 4, 4, 4, 5, 5, 7, 9]).describe()
count    8.00000
mean     5.00000
std      2.13809
min      2.00000
25%      4.00000
50%      4.50000
75%      5.50000
max      9.00000
count, mean, min and max match hand arithmetic exactly — sum(values) / len(values) = 5.0, min = 2, max = 9 — and the standard deviation matches Day 116’s Bessel-corrected sample formula, dividing the sum of squared deviations by n - 1 rather than n, to nine decimal places, confirmed independently in examples/09_describe_known_column.py.
.info() reports row count, column names, non-null counts and dtypes in one compact block — the fastest way to spot a column that is not what you expected, including, as of pandas 3.0, printing str rather than object for a text column. .head() (and its counterpart .tail()) prints the first (or last) n rows without disturbing the frame, the first thing worth running on any data you have not seen before, purely to sanity-check that it loaded the way you expected. .memory_usage(deep=True) reports the real byte cost per column, including the string-storage subtlety from the dtypes section above — and, for the pandas-3.0 str dtype specifically, deep=True and deep=False now agree, which is itself a useful diagnostic: if the two disagree on a text column, that column is still object, not str.
An everyday analogy
Carry one picture through the rest of this lesson: the index is a name tag, not a seat number.
Imagine two separate guest lists for the same wedding, compiled by two different people. One list, written by the caterer, has a name tag and a meal choice for each guest. The other, written by the seating coordinator, has a name tag and a table number. To produce the final “meal per table” plan, you do not assume guest number 7 on one list is the same person as guest number 7 on the other — the two lists were almost certainly compiled in different orders, and lining them up by position would hand somebody else’s steak order to whoever happened to be seventh on a different sheet. You match by the name tag: find “Priya Nair” on both lists, and combine her meal choice with her table number. That is .loc and index alignment, exactly. If a guest appears on the caterer’s list but was added to the seating chart late — or vice versa — the match for that one name comes back incomplete, which is precisely what NaN represents: not an error, but an honest “I could not find this name on the other list.”
A NumPy array, without an index, is the version of this problem where nobody wrote name tags — only seat numbers, assigned in whatever order each list happened to be typed. Two seat-numbered lists combine correctly only by luck, when both happen to have been typed in the same order with nothing missing from either — and there is no way, from the numbers alone, to tell whether that luck held.
Push the analogy one step further, into Copy-on-Write. df[mask] is like photocopying the caterer’s list, filtered down to just the vegetarians, before writing a correction on the photocopy — the correction is real, and it exists, but it exists only on a piece of paper that gets thrown in the recycling the moment you set it down, because nobody kept a reference to it. df.loc[mask, "meal"] = "vegetarian" is writing directly on the original list. Both actions look, in the moment, like “I corrected the record” — the pen moved, ink went down — but only one of them changed the document anyone will read again.
The analogy has an honest limit, worth stating rather than glossing over: a real guest list, once photocopied, stays photocopied — the two pieces of paper are physically separate from that point forward. A pandas Series under Copy-on-Write is more careful than that: it shares the same underlying memory with the original for as long as nothing writes to either copy, and only actually duplicates the data at the moment a write would otherwise affect both — which is the “write” half of “Copy-on-Write”, and the reason it exists at all rather than pandas simply copying everything, always, just to be safe.
Examples in practice
A feature column silently corrupted by a join. Two DataFrames, orders and customer_scores, both indexed by customer ID — except customer_scores was built from a query that excluded customers with fewer than three orders. orders["score"] = orders["base_score"] + customer_scores["adjustment"] runs without complaint. Every customer excluded from customer_scores gets NaN in the result — not zero, not an error, NaN — and if the very next line is .fillna(0), every one of those customers now has a 0 adjustment that looks exactly as valid as a genuinely-computed 0 would. This is the opening example of this lesson, wearing a production pipeline’s clothes.
An ID column that quietly became a float. A customer_id column, declared (or inferred as) int64, goes through a left join against a table that does not have every ID — the unmatched rows get NaN in every joined column, and because that NaN lands in what was an int64 column, the entire customer_id column is promoted to float64. Six months later, someone exports the column to a CSV for a downstream system, and every ID prints with a trailing .0 — 1001.0 instead of 1001 — which some downstream parsers accept silently and some reject outright. The fix decided before the join, not after: declare join keys as the nullable Int64 from the start.
A report that “worked” until the input changed shape. A script sums two columns from two different queries, run at different times of day against a database that is still receiving writes. On most days the two queries happen to return rows in matching order and the sum is correct by coincidence. One day a new row is inserted between the two queries running, shifting every row after it in one result but not the other — and because both Series still had the default RangeIndex, position-based rather than label-based, the sum silently combines the wrong rows. The general lesson: the default RangeIndex gives you no protection at all against exactly the failure this whole lesson is about — meaningful alignment requires a meaningful index, deliberately set.
Implications: security, privacy, performance, scalability, and cost
Privacy and correctness are the same failure here. Index-misalignment NaNs are not a performance nit; they are a data-integrity failure that happens to look like ordinary missing data. A fillna(0) after a silent misalignment does not just produce a wrong number — it produces a wrong number that carries no signal that anything went wrong, which is a worse failure mode than an exception, because an exception at least gets investigated.
Performance: vectorisation is not optional past a few thousand rows. The roughly 250x gap measured above between vectorised arithmetic and .apply with a lambda is not an edge case; it is the ordinary cost of paying Python’s interpreter overhead once per row instead of once per operation. A DataFrame pipeline written entirely in .apply calls scales linearly worse than the same pipeline written vectorised, and the gap widens, not narrows, as the data grows.
Memory: str versus object is now a real, checkable cost, not a guess. The pandas-3.0 str dtype’s PyArrow backing genuinely uses less memory per string than the legacy object dtype’s array-of-pointers representation, and — unlike before 3.0 — you can now check this directly with .memory_usage(deep=True) without a surprise, because deep=True and deep=False agreeing on a str column is itself confirmation there is no hidden pointer overhead left to find.
Cost, in the exact-arithmetic sense: Int64 versus int64 is a precision decision with a dollar-and-cents analogue to Day 91’s integer-money lesson. An order ID, an account number, or any identifier that must never be approximated deserves the nullable Int64 dtype specifically because the alternative — silent promotion to float64 past a join or a reindex — is not a performance cost, it is a correctness cost, identical in kind to the floating-point money bug Day 91 covered, just triggered by a missing value instead of a fraction.
Scalability: Copy-on-Write changes the cost model of “just make a copy to be safe”. Before pandas 3.0, defensively copying a large DataFrame before modifying it was often expensive enough that people avoided it and accepted the risk of accidental in-place mutation instead. Copy-on-Write’s shared-memory-until-written design means a defensive .copy() (or simply relying on the fact that unmodified data is never duplicated) is now close to free until an actual write happens — which removes a real incentive people previously had to reach for chained assignment’s dangerous shortcuts.
Alternatives: free, open source, and commercial
pandas — free, BSD 3-Clause. The subject of this lesson, and the default choice for tabular data analysis in Python. When to choose it: the data fits comfortably in memory, one process is doing the analysis, and you want the largest possible ecosystem of compatible tools (scikit-learn, matplotlib, statsmodels) built to expect exactly its API. How: import pandas as pd; everything in this lesson. Free vs paid: entirely free, no tier.
polars — free, MIT licence. A newer DataFrame library, written in Rust, built from the start around multi-threaded execution and, notably for this lesson, a deliberately different design decision about the index: polars DataFrames have no implicit row index at all. That single design choice is worth sitting with, because it sharpens exactly what this lesson has been about. Every alignment behaviour covered today — the NaNs from mismatched labels, the .loc/.iloc distinction, the reason .reset_index(drop=True) is sometimes the right move — exists because pandas gives every row a persistent, checkable identity beyond its position. polars’ designers judged that identity to be a cost more often than a benefit for the workloads polars targets, and built row-order-based operations as the default instead, with any row-identity tracking left to an explicit column you add yourself. Neither design is simply “better” — pandas’ index buys you exactly the safety this lesson has spent its length explaining, at the cost of exactly the confusion this lesson has spent its length untangling; polars buys you a simpler mental model and, for large data, meaningfully faster execution, at the cost of losing that automatic safety net entirely. When to choose polars: performance-critical pipelines on data too large for comfortable pandas use, or a team that has decided the index’s implicit-alignment behaviour is a liability they would rather design around explicitly. How, from its documentation: pl.DataFrame({"x": [1, 2, 3]}) builds a frame with the same dict-of-lists syntax pandas uses, but operations like + between two pl.Series are always positional — there is no label to align on. This lesson does not run polars — it is not installed in the authoring environment — and no output attributed to it above is anything but a description of its documented behaviour, stated plainly as such.
NumPy structured arrays — free, BSD 3-Clause, docs-only here. NumPy itself offers a limited answer to heterogeneous, labelled-by-name (though not labelled-by-row) data: numpy.dtype([("id", "i8"), ("price", "f8")]) defines a compound dtype, and an array built with it lets you access arr["price"] the way you would a DataFrame column. When to choose it: you need heterogeneous columns but genuinely cannot add a pandas dependency, or you are interoperating with C code that expects a raw structured buffer. How, from documentation: np.array([(1, 19.99), (2, 44.50)], dtype=[("id", "i8"), ("price", "f8")]). The honest catch: no row index, no automatic alignment, no NaN-aware missing-value handling, and a noticeably more awkward syntax for anything beyond simple column access — structured arrays are closer to a C struct array than to a DataFrame, and this lesson recommends them only when a pandas dependency is genuinely off the table.
SQLite / SQL generally, Week 13’s subject — free, public domain (SQLite specifically). When to choose SQL over pandas: the data does not fit comfortably in memory, more than one process needs to read or write concurrently, you need durable storage with transactional guarantees, or the questions being asked are naturally expressed as joins and aggregates over data that already lives in a relational database. How: everything Week 13 covered — SELECT, JOIN, GROUP BY, window functions — running against the file or server directly, rather than loading the whole table into a DataFrame first. Concrete example: Day 121’s “Loading and Inspecting Data” covers pd.read_sql(), the actual bridge between the two — often the right answer is “SQL to filter and aggregate down to a manageable size, then pandas for the fine-grained shaping” rather than choosing one exclusively. Free vs paid: SQLite is free with no server to run at all; PostgreSQL and MySQL are free and open source with paid managed-hosting options; commercial data warehouses (Snowflake, BigQuery) are usage-priced and outside the scope of this lesson.
Comparison with related concepts
| Concept | What it does | How it differs from a pandas DataFrame |
|---|---|---|
NumPy ndarray | A fixed-dtype, N-dimensional array | No labels at all; a Series is an ndarray with a label axis bolted on (Day 104) |
Python dict of lists | A mapping of column names to value lists | No row-level index, no vectorised arithmetic, no dtype enforcement per column |
| SQL table | Rows and typed columns, durable, queryable concurrently | Lives on disk/server, not in memory; no implicit positional index at all; concurrency-safe |
polars DataFrame | Rows and typed columns, in memory, multi-threaded | No implicit row index by design; operations are positional, not label-aligned |
| NumPy structured array | A single array with named, typed fields | No row index, no built-in missing-value handling, more C-struct-like than table-like |
| CSV file | Plain-text rows and columns | No types until parsed, no index until one is chosen at load time, no in-memory computation |
R data.frame | pandas’ direct ancestor in spirit | Different language and ecosystem; conceptually the closest relative on this list |
The comparison worth dwelling on is polars versus pandas, because it is the only pair on this table making a genuinely different design choice about the same problem rather than solving a different problem entirely. Every other row in this table lacks something pandas has (a label axis, vectorisation, in-memory speed); polars deliberately omits the one thing this entire lesson has centred on, on purpose, as a considered trade-off rather than an oversight.
When to use it — and when not to
Reach for a pandas DataFrame when your data fits comfortably in memory, you are the only process reading and writing it at a time, and you want the richest available ecosystem of compatible tools built around exactly its API — which, as of 2026, is still the majority of tabular work done in Python.
Reach for SQL instead when the data does not fit in memory, more than one process needs concurrent access, or you need transactional guarantees pandas does not provide at all — Week 13 covers exactly this boundary.
Reach for polars instead when performance on large in-memory data matters more than the automatic label-alignment safety net this lesson has spent its length explaining, and your team is comfortable designing around explicit row identity rather than an implicit one.
Always declare a meaningful index before doing arithmetic across two DataFrames or Series that did not originate from the same object, and always check .isna().sum() immediately after any join or reindex whose row counts you have not independently verified — this single habit catches the overwhelming majority of the silent-corruption failures this lesson describes, before they reach anything downstream.
Never use chained assignment, even in a script you consider throwaway. On pandas 3.0.5 it does not work, at all, and the warning it raises is easy to miss; on any earlier pandas, whether it appears to work depends on internal memory layout that was never a documented guarantee in the first place, which means “it worked when I tested it” was never evidence that it would keep working.
Never assume an integer column is safe from becoming float64 unless you have specifically declared it Int64 and confirmed every operation that touches it preserves that dtype — checking .dtype after every join, reindex or concat that touches an ID column costs one line and catches this before it reaches a downstream system that cannot parse 1001.0.
Where this goes next in AI work
Every machine-learning pipeline you will ever build begins with a DataFrame, and the specific failure mode this lesson opened with — index-misalignment producing NaN that a downstream fillna then buries — is one of the quietest ways a feature set gets corrupted before a model ever sees a single row of it. Two features engineered from differently filtered queries, joined on customer ID, will produce NaN for every customer missing from either side, and the very next line in an enormous number of real feature-engineering scripts is exactly .fillna(0) — which turns “we don’t have this data” into “this value is genuinely zero”, a claim the pipeline has no basis for making and no record of having made.
The consequence compounds specifically because it is silent. A model trained on a feature column with buried NaNs does not fail loudly; it learns a slightly wrong relationship, quietly, and the only symptom is a model that underperforms in a way nobody can trace to a specific cause, because the corruption happened upstream of every diagnostic anyone thinks to run. The discipline this lesson exists to install is not “never let NaN appear” — real data has real gaps, and NaN representing them honestly is pandas working correctly. The discipline is: know, at every join and every arithmetic operation between two differently-sourced Series, whether alignment is doing something you intended or something you never checked for, and treat every unexpected NaN after a join as a question to answer rather than a default to paper over. Week 18’s project, the Messy Dataset Rescue, is built directly on this habit — a genuinely messy public dataset, and a documented, reproducible record of exactly which values were missing, why, and what was decided about each one, rather than a single silent fillna(0) applied to everything at once.
Knowledge check
Try these from memory before looking back.
- What is the one addition a pandas Series has over a bare NumPy array, and why does that one addition explain every idea in this lesson?
- Predict, without running it, what
pd.Series([1, 2, 3], index=["a","b","c"]) + pd.Series([10, 20], index=["b","x"])returns, labelled and all. - Name the two clean ways to opt out of index alignment and say when each is the right choice.
- State exactly what happens, mechanically, when you write
df[mask]["col"] = valueon pandas 3.0.5 — both to the original frame and in terms of the warning raised. - What is the one-line fix for chained assignment, and why does it work when the two-statement form does not?
pd.Series(["a", "b"]).dtypeprints what, on pandas 3.0.5? What did it print on pandas 2.x, and why did that change?- An
int64Series is reindexed onto a label it never had. What dtype does it become, and why canint64not represent the result directly? - What does the nullable
Int64dtype (capital I) do differently fromint64when a value is missing, and what precision problem does that avoid? - State the exact rule for
.loc’s stop value versus.iloc’s stop value on a slice. Give an example where writing the “matching” number for both produces different row counts. - Why does
series == np.nannever find a missing value, no matter how many are present? What should you write instead? - Report the measured gap between vectorised arithmetic and
.apply(lambda ...)the way this lesson insists on reporting it. What form of report would be wrong, and why? - Name the four commands this lesson calls “what you run on any new frame”, and say what each one is for.
- What single design decision does polars make differently from pandas regarding the index, and what does that trade-off buy and cost?
- Give one concrete example of how an unexamined
NaNfrom a join can silently corrupt a machine-learning feature column. - Which is the “day’s most important check” in this lesson’s lab, and why does the lesson single it out?
Hands-on exercise
The Day 120 lab, Frames You Can Trust, is nine numbered exercises, each proving one of the claims above by running real pandas 3.0.5 code and checking the real result — never by reading source or trusting a comment. Work from the lab directory; every command below runs from there.
Set up the lab’s own environment first, since this day’s captured output is tied to the exact pinned versions:
cd labs/sections/math-statistics-and-data/day-120-pandas-series-and-dataframes
python3 -m venv .venv
.venv/bin/pip install -r requirements/requirements.txt
Confirm the harness is green before touching anything:
bash tests/run_tests.sh
echo "exit code: $?"
Then find out where you stand on the nine exercises:
.venv/bin/python3 starter/check_progress.pyIt reports 0 of 9 exercises complete. and names the exact _FILL_THIS_IN marker each unfinished exercise is waiting on. Open starter/exercises.py, replace each marker with real pandas code — one function per exercise, matching the nine ideas covered above in order — and re-run the checker as you go.
When you have attempted every exercise yourself — and only then — read the fully worked reference in examples/, one script per exercise, each ending with a printed line confirming every internal assertion held:
cd examples
../.venv/bin/python3 01_three_ways_to_build.py
../.venv/bin/python3 02_alignment.py
../.venv/bin/python3 03_dtype_promotion.py
../.venv/bin/python3 04_copy_on_write.py
../.venv/bin/python3 05_loc_vs_iloc.py
../.venv/bin/python3 06_nan_semantics.py
../.venv/bin/python3 07_vectorized_vs_apply.py
../.venv/bin/python3 08_string_dtype.py
../.venv/bin/python3 09_describe_known_column.py
cd ..
Expected output
The harness ends with a real captured line:
41 checks, 0 failure(s).and exits 0. starter/check_progress.py reports 0 of 9 exercises complete. with exit 1 on the untouched checkout, and 9 of 9 exercises complete. with exit 0 once every marker is correctly replaced.
The day’s two sharpest facts, exactly as captured on pandas 3.0.5:
pd.Series(['a', 'b']).dtype -> strdf['b'] before: [10, 20, 30]
df['b'] after chained assignment `df[df['a'] > 1]['b'] = 0`: [10, 20, 30]
warning(s) raised by that statement: ['ChainedAssignmentError']
df['b'] after `.loc[df['a'] > 1, 'b'] = 0`: [10, 0, 0]Validate your work
bash tests/run_tests.shends with41 checks, 0 failure(s).and exits 0.pd.Series(['a', 'b']).dtypereadsstr, notobject.- Chained assignment leaves
df['b']at[10, 20, 30], unchanged, and raises aChainedAssignmentErrorwarning; the equivalent.locstatement changes it to[10, 0, 0]. - Adding
x(indexa, b, c) toy(indexb, c, d) putsNaNat exactlyaandd, and sumsbto 12.0 andcto 23.0. df.loc['b':'d']anddf.iloc[1:4]return the same three rows;df.iloc[1:3]returns one row fewer, even though3is the position of the label'd'that.locincluded.- An
int64column reindexed onto a label that was never there becomesfloat64, and a value past2**53loses exact precision; the same reindex on anInt64column keeps its dtype and its precision. .describe()on[2, 4, 4, 4, 5, 5, 7, 9]gives count 8, mean 5.0, min 2, max 9, matching Day 116’s Bessel-corrected standard deviation to nine decimal places.- Vectorised arithmetic beats
.apply(lambda ...)by at least 20x on 200,000 rows. starter/check_progress.pyreports0 of 9on an untouched checkout and9 of 9once every exercise is correct.
Troubleshooting
troubleshooting.md in the lab directory has the full list, grouped by the message you actually see. The ones you are most likely to meet: pd.Series(['a', 'b']).dtype prints object, not str — you are not running pandas 3.0.5, check with python3 -c "import pandas; print(pandas.__version__)" and reinstall from requirements.txt. Chained assignment doesn’t warn, or silently updates the frame — the same root cause: you are not on pandas 3.0’s unconditional Copy-on-Write. .iloc[1:3] returns one row fewer than expected — not a bug; .iloc stops before its stop position while .loc stops at and including its stop label. An ID column now prints with a trailing .0 — a NaN entered an int64 column through a join or reindex and promoted the whole column; declare it Int64 if it must never lose exact precision. KeyError from .loc[3] where .iloc[3] would have worked — your index is not the default 0, 1, 2, ... RangeIndex, most often because you filtered or sorted without .reset_index(drop=True).
Common mistakes
- Assuming
+between two Series is positional. It is label-based, always, whether or not the two indexes happen to already agree. - Writing chained assignment and trusting that it “usually works”. On pandas 3.0.5 it structurally cannot; on earlier pandas, whether it appeared to work depended on internal memory layout that was never a documented guarantee.
- Ignoring the
ChainedAssignmentErrorwarning because it doesn’t stop execution. It is aWarning, not a raised exception — the statement completes and moves on, which is exactly why it is easy to miss. - Declaring an ID column
int64without checking whether it will ever meet aNaN. Any column that will be joined, merged, or reindexed should default toInt64unless you have confirmed otherwise. - Writing
.ilocwith the same stop number as a.locslice “because they look equivalent”. They are equivalent only when the.ilocstop is one past the.locstop’s position. - Testing for missing values with
series == np.nan. It is always all-False. Use.isna(). - Reporting a timing comparison as a millisecond figure. Report a ratio and a shape — the millisecond number is a fact about one machine on one day.
- Assuming
.memory_usage()’s default (deep=False) tells the whole story for a text column. For the legacyobjectdtype it dramatically understates the real cost; for the pandas-3.0strdtype the two now agree, which is itself useful information.
Practice assignment
Take a dataset with at least two independently-sourced tables that share a key — two CSV exports from different systems, two API responses fetched separately, or two DataFrames you construct yourself with deliberately different index gaps — and produce a short, honest report on what happens when you combine them.
First, load both into DataFrames and set the shared key as the index on each with .set_index(), rather than leaving the default RangeIndex in place. Run .isna().sum() on the result of combining them (an addition, a .merge(), or a .join()) before doing anything else with it, and write down exactly which rows produced NaN and, separately, whether you can explain why each one did — a genuinely missing record on one side, a duplicate key, a type mismatch in the join column.
Then, deliberately introduce the mistake this lesson opens with: recompute the same combination using .to_numpy() on both sides instead of the labelled objects, and compare the two results row by row. Write down every row where the labelled and the positional answers disagree, and confirm you can explain the disagreement from the two objects’ indexes alone, without re-running anything.
Then, find one integer-typed column in your data that has, or could plausibly gain, a missing value, and check whether it is declared int64 or Int64. If int64, force a reindex onto a label it does not have, confirm the promotion to float64, and rewrite the column as Int64 to show the promotion no longer happens.
Your deliverable is the two DataFrames, the combination with its NaN count and an explanation for each one, the labelled-versus-positional comparison with every disagreement named, and the before/after dtype fix — plus one paragraph stating, honestly, whether you would have caught this specific corruption before this lesson, and what check you are adding to your own workflow because of it.
Extension challenge
Build a small, from-scratch “aligning array” in plain Python — no pandas, no NumPy — that reproduces exactly the index-alignment behaviour this lesson opened with, to prove to yourself it is a specific, implementable algorithm rather than something mysterious pandas does internally.
Write a class wrapping two parallel Python lists, one of labels and one of values, with an __add__ method that: computes the union of both operands’ labels, builds a result list the length of that union, and for each label in the union, adds the two values together only if that label exists in both operands — writing None (your stand-in for NaN) everywhere it does not. Test it against the exact example this lesson opened with — labels a, b, c and values 1, 2, 3 on one side, labels b, c, d and values 10, 20, 30 on the other — and confirm your from-scratch result matches pandas’ real x + y output exactly: a: None, b: 12, c: 23, d: None.
Then extend it one step further: implement a from-scratch .loc-style slice that is inclusive of its stop label, and a separate .iloc-style slice that is exclusive of its stop position, on the same underlying data, and confirm both agree with pandas’ real behaviour on the a..e example from the “How it works” section — including the one-row difference between .loc['b':'d'] and .iloc[1:3]. Having built the mechanism yourself, in fewer than fifty lines, is the fastest way to stop finding pandas’ alignment behaviour mysterious and start finding it, correctly, obvious.
Quiz
Q1. Two Series are added: x has index a, b, c with values 1, 2, 3; y has index b, c, d with values 10, 20, 30. What does x + y put at label 'a'?
- 1, unchanged, because a only appears in x
- 11, because pandas fills the missing side with the first value of y
- An error is raised because the indexes do not match
- NaN, because pandas aligns by label and a has no partner in y
Show answer
Answer: D. NaN, because pandas aligns by label and a has no partner in y
Addition between two Series aligns on the UNION of both indexes first, then adds. Label a exists only in x, so there is nothing on the y side to add to, and pandas writes NaN rather than guessing a value or silently reusing x's own number. This is the opening failure of the whole lesson: the operation succeeds and returns a plausible-looking Series, with no exception anywhere.
Q2. On pandas 3.0.5, what does pd.Series(['a', 'b']).dtype return?
- str, the new pandas 3.0 default for a column of Python strings
- object, the same as every earlier pandas version
- string, a legacy alias kept for backward compatibility
- category, because pandas infers repeated short strings as categorical
Show answer
Answer: A. str, the new pandas 3.0 default for a column of Python strings
pandas 3.0, built on PyArrow, made str the default dtype for a column of Python strings, replacing object in that role. object still exists and is still what a genuinely mixed-type column falls back to, and remains available on request with dtype="object", but it is no longer the default for a column that is actually just text -- which almost every tutorial written before 3.0 still assumes.
Q3. On pandas 3.0.5, what happens when you run df[df['a'] > 1]['b'] = 0 on a DataFrame df?
- df is updated correctly, and a SettingWithCopyWarning is raised
- A hard exception is raised immediately and the line never completes
- df is left completely unchanged, and a ChainedAssignmentError warning explains why
- df is updated only for the first matching row, silently
Show answer
Answer: C. df is left completely unchanged, and a ChainedAssignmentError warning explains why
df[df['a'] > 1] is evaluated first and produces a temporary DataFrame; ['b'] = 0 assigns into that temporary, which is then discarded. The original df is never touched. pandas 3.0.5 raises a ChainedAssignmentError -- a Warning subclass, not a raised exception, so the statement still "completes" -- naming the exact fix: a single .loc[row_indexer, col_indexer] = value statement.
Q4. On a DataFrame indexed a, b, c, d, e, which pair of slices returns the identical three rows (b, c, d)?
- df.loc['b':'d'] and df.iloc[1:3]
- df.iloc[1:3] and df.iloc[1:4]
- df.loc['b':'e'] and df.iloc[1:4]
- df.loc['b':'d'] and df.iloc[1:4]
Show answer
Answer: D. df.loc['b':'d'] and df.iloc[1:4]
.loc's stop is a label to INCLUDE; .iloc's stop is a position to stop BEFORE. 'd' sits at position 3, so .loc['b':'d'] and .iloc[1:4] -- a DIFFERENT stop number -- return the same three rows. .iloc[1:3] stops before position 3, dropping 'd' and returning only two rows, even though 3 looks like the "matching" number to someone reading the .loc slice.
Q5. Why does `some_series == np.nan` never find a Series' missing values, even where they really are?
- It does find them; == np.nan is the recommended way to test for missing data
- np.nan only matches values assigned with the literal token np.nan, not pd.NA or None
- NaN is never equal to anything, including itself, so every comparison against it returns False
- == raises a TypeError when comparing against NaN, which pandas silently swallows
Show answer
Answer: C. NaN is never equal to anything, including itself, so every comparison against it returns False
NaN follows IEEE 754: NaN != NaN by definition, and every comparison against NaN using ==, <, >, <=, >= returns False, never an error. That is exactly why .isna() exists as a dedicated method -- it checks the underlying missing-value marker directly rather than relying on equality, which can never succeed against NaN by construction.
Q6. An int64 column is reindexed onto a label it never had before. What happens to the column's dtype, and why?
- It stays int64, with the new row left uninitialized
- The whole column is promoted to float64, because int64 has no bit pattern for a missing value
- Only the new row becomes a separate float64 Series; the rest stays int64
- pandas raises a ValueError, refusing the reindex
Show answer
Answer: B. The whole column is promoted to float64, because int64 has no bit pattern for a missing value
NumPy's int64 has no reserved bit pattern for "missing". The instant a missing value enters an int64 Series -- through a reindex, a failed join, or an explicit NaN assignment -- pandas rebuilds the ENTIRE column as float64, which does have NaN available. This can silently cost precision past 2**53 for large integer IDs. The nullable Int64 dtype (capital I) avoids this by staying in the integer family and using pd.NA instead.
Q7. A vectorised column operation runs roughly 250x faster than the equivalent .apply(lambda x: ...) on 200,000 rows, measured on one machine on one day. How should this lesson's discipline report that gap?
- As an exact benchmark: '.apply is 187.9 milliseconds slower per call'
- As a ratio and a shape: 'at least 20x faster on 200,000 rows', never a millisecond figure
- It should not be reported at all, since timing is not reproducible
- As a percentage improvement relative to a Python for-loop baseline
Show answer
Answer: B. As a ratio and a shape: 'at least 20x faster on 200,000 rows', never a millisecond figure
A millisecond figure is a fact about one machine on one day and misleads if quoted more precisely than that. Reporting a ratio with a comfortable margin below the measured value -- '.apply is at least 20x faster on 200,000 rows,' measured here at roughly 250x -- is a claim that holds on hardware slower or faster than the one it was measured on, which a specific millisecond number cannot promise.
Q8. What design choice does polars make differently from pandas that this lesson uses as a contrast to sharpen what the pandas index actually costs and buys?
- polars has no support for missing values at all
- polars stores every column as a Python object, regardless of its contents
- polars cannot represent more than one dtype per DataFrame
- polars has no implicit row index; operations are positional by design, with no built-in alignment
Show answer
Answer: D. polars has no implicit row index; operations are positional by design, with no built-in alignment
polars DataFrames have no implicit row index at all -- a deliberate design decision. Every alignment behaviour this lesson covers (the NaN from mismatched labels, .loc vs .iloc, when .reset_index(drop=True) is the right move) exists because pandas gives every row a persistent, checked identity beyond its position. polars judged that identity a cost more often than a benefit for its target workloads, trading pandas' automatic safety net for a simpler, purely positional model and, for large data, faster execution.
Glossary
- Series
- A one-dimensional pandas data structure: a sequence of values paired with a sequence of labels called the index. The values are typically backed by a NumPy array (or, for certain dtypes since pandas 2.0, a PyArrow array); the index is what a bare NumPy array does not have.
- DataFrame
- A pandas data structure representing a table: a collection of Series that all share the same index. Each column keeps its own dtype independently; the shared index is what lets df.loc["c"] pull the same logical row out of every column at once.
- index
- The array of labels attached to a Series or DataFrame's rows. Two Series with different indexes do not correspond position by position; arithmetic between them aligns on the labels first.
- index alignment
- The rule that binary operations between two Series (or DataFrames) compute the union of both indexes, reindex both operands onto it (filling missing positions with NaN), and only then perform the elementwise operation. Alignment happens unconditionally, whether or not the two indexes already agree.
- Copy-on-Write (CoW)
- pandas' memory-management strategy, unconditional as of pandas 3.0, in which a Series or DataFrame derived from another shares the same underlying memory until either object is written to, at which point the write triggers an actual copy so the other object is unaffected. It is what makes chained assignment fail to reach the original object.
- chained assignment
- Writing two indexing operations back to back in one assignment statement, such as df[mask]["col"] = value. The first indexing operation produces a temporary object; the assignment writes into that temporary, which is then discarded, so the original object is never modified. On pandas 3.0.5 this raises a ChainedAssignmentError warning.
- ChainedAssignmentError
- A Warning subclass (not a raised exception) that pandas 3.0.5 emits when it detects chained assignment. The statement still completes and execution continues, which is why the warning is easy to miss if warnings are filtered or the script's stderr is not read.
- .loc
- A label-based indexer. df.loc[row_label, col_label] selects by the labels present in the index and columns. A slice given to .loc is inclusive of its stop label: df.loc["b":"d"] includes the row labelled "d".
- .iloc
- A positional indexer, exactly like indexing a Python list or NumPy array by integer position, regardless of the labels present. A slice given to .iloc is exclusive of its stop position, matching ordinary Python slice semantics.
- dtype
- The single data type every value in a given Series or column shares. Common dtypes include int64, float64, bool, and, as of pandas 3.0, str (replacing object as the default for text columns).
- str dtype (pandas 3.0)
- The default dtype pandas 3.0 assigns to a column built from Python strings, backed by PyArrow's contiguous string storage. It replaces object as the default; object remains available on request and is still what a genuinely mixed-type column falls back to.
- object dtype
- The pre-pandas-3.0 default dtype for a column of strings (and the dtype still used for genuinely mixed-type columns on any pandas version): an array of pointers to separately allocated Python objects, with no contiguous storage benefit.
- dtype promotion
- The automatic widening of a column's dtype -- most commonly int64 to float64 -- that pandas performs when a value the original dtype cannot represent (such as a missing value) is introduced. int64 has no bit pattern for "missing"; float64 does, via NaN.
- Int64 (nullable integer dtype)
- A pandas extension dtype (capital I, distinct from lowercase int64) that stays in the integer family while supporting a missing-value marker (pd.NA) instead of borrowing NaN from float64. It avoids the precision loss that int64-to-float64 promotion causes past 2**53.
- NaN
- "Not a Number", the IEEE 754 floating-point value used to represent a missing entry in a float64 column. By the IEEE 754 standard, NaN is never equal to anything, including itself, so series == np.nan can never find it; .isna() is the reliable test.
- pd.NA
- pandas' newer, dtype-agnostic missing-value marker, used by nullable extension dtypes such as Int64, distinct from the float-only NaN.
- .isna()
- A Series or DataFrame method that returns a boolean mask marking which positions hold a missing value, checking the underlying missing-value representation directly rather than relying on equality comparison, which can never succeed against NaN.
- vectorisation
- Expressing a computation as one operation over a whole array or Series, which runs inside compiled code, rather than looping over elements in interpreted Python (as .apply(lambda ...) does). Covered first for bare NumPy arrays on Day 104.
- .describe()
- A DataFrame or Series method that computes count, mean, standard deviation, min, the quartiles, and max for every numeric column at once -- the same summary statistics Day 116 covered computing by hand, including Bessel's correction for the standard deviation.
- memory_usage(deep=True)
- A DataFrame method reporting the real byte cost per column. For the pandas-3.0 str dtype, deep=True and deep=False agree, because the underlying storage is already contiguous; for the legacy object dtype, deep=True reports substantially more, revealing the cost of the pointer indirection that deep=False cannot see.
- RangeIndex
- The default index pandas assigns when nothing else is specified: the integers 0, 1, 2, ... in order. It offers no protection against index-alignment surprises, because it is positional by construction rather than meaningfully labelled.
- polars
- A DataFrame library for Python, written in Rust, built around multi-threaded execution. Unlike pandas, polars DataFrames have no implicit row index at all; every operation is positional by design, trading pandas' automatic label-alignment safety net for a simpler model and, on large data, faster execution.
Sources and further reading
- Intro to data structures — pandas Development Team (accessed 2026-08-19)
- Copy-on-Write (CoW) — pandas Development Team (accessed 2026-08-19)
- Indexing and selecting data — pandas Development Team (accessed 2026-08-19)
- pandas.DataFrame.describe — pandas Development Team (accessed 2026-08-19)
- numpy.ndarray — NumPy Developers (accessed 2026-08-19)
Kept in this browser, no account needed. Your progress page turns the whole record into one link you can bookmark or open on another device.