Math, Statistics, and Data › Working with Real Data › Day 136
Day 136: The Exploratory Data Analysis Process
After this lesson you will be able to run an exploratory analysis you can defend rather than merely believe. You will measure, by exact formula and by simulation, that k independent alpha=0.05 comparisons on data with no real signal produce at least one "significant" result 1 - 0.95^k of the time -- 22.6% at k=5, 64.15% at k=20, 87.15% at k=40 -- and you will show why the "winning" comparison in such a search is tempting to report rather than obviously wrong, because it can carry a publishable-looking effect size as well as a low p-value. You will build the day's centrepiece on real data: a genuine, planted effect and thirty spurious columns, split into an untouched confirmation set before any hypothesis is chosen, where the real effect survives testing on the confirmation half and the best-looking spurious column does not. You will quantify how much a silent choice of subset filter or outcome definition -- with no test ever formally declared -- inflates an apparent significance rate, apply Bonferroni correctly when the comparison count is known, and demonstrate precisely how the same correction fails when the true count exceeds the reported one. You will build a research log whose own length is the true comparison count, score candidate questions by expected information, cost and decision relevance, and measure how much a "stop when significant" rule inflates the real false-positive rate over a time-boxed one using the identical budget of looks. You will assemble the handoff object a report stage needs -- a finding, its confirmation-set result, and a comparison count -- and prove the report stage refuses to run without all three. You will also be able to state, with your own measured numbers, why reporting the best of a hundred trained model configurations is the same failure mode wearing different clothes.
Hands-on lab for this lesson
Lab files on GitHub: https://github.com/ai-roadmap-365/ai-roadmap-365.github.io/tree/main/labs/sections/math-statistics-and-data/day-136-the-exploratory-data-analysis-process
- Get the hands-on files. Clone the labs repository once (you can reuse this clone for every lesson). This works on macOS, Linux, and Windows (PowerShell or WSL):
git clone https://github.com/ai-roadmap-365/ai-roadmap-365.github.io.git cd ai-roadmap-365.github.io - Open this lesson's lab. Move into the directory for this specific day. Every lab lives at the same predictable path — section / subsection / week / day:
cd labs/sections/math-statistics-and-data/day-136-the-exploratory-data-analysis-process - Read the lab guide. Open `README.md` in that directory. It lists the exact commands, what each does, the expected output, and how to check your work — read it before running anything.
- Run it and check your work. Follow the README's "How to run" section: run the example first to see the finished result, then complete the numbered exercises in `starter/`, then run the tests. The tests pass (exit 0) only when your work is correct.
bash tests/run_tests.sh # or the test command named in the lab README
You can also open the lab as a local page (works offline, shows the file tree and expected output).
Learning objectives
By the end of this lesson you will be able to:
- State and defend the sentence this lesson exists to teach: a p-value is only meaningful if you can say how many things you looked at
- Measure, by exact formula and by simulation, the chance that k independent alpha=0.05 comparisons on data with no real signal produce at least one false positive, for k=5, 20 and 40
- Explain why a forking-paths result is tempting to report rather than obviously wrong, by showing that the winning comparison in such a search can carry a publishable-looking effect size
- Hold out a confirmation set before forming a hypothesis, and demonstrate both outcomes on real data: a genuine effect surviving confirmation, and a spurious one chosen for looking best on exploration failing it
- Show, quantitatively, that varying a subset filter or an outcome definition -- with no test formally declared per variant -- still inflates the apparent significance rate several times over one pre-declared comparison
- Apply a Bonferroni correction correctly when the comparison count is known, and demonstrate precisely how it fails when the true count exceeds the reported one
- Build a research log as a data structure whose own length is the true comparison count, recording every question, look and outcome including the nothings
- Score candidate questions by expected information, cost and decision relevance, and rank them the way Day 119 frames whether an answer would change a decision
- Measure, by simulation, how much a "stop when significant" rule inflates the real false-positive rate above a time-boxed rule using the identical budget of looks
- Build the handoff object a report stage needs -- a finding, its confirmation-set result, and a comparison count -- and prove the report stage refuses to run without all three
- Choose among pandas/NumPy, Jupyter with nbconvert, statsmodels multiple-comparisons corrections, and an experiment tracker such as Weights & Biases for a given exploratory task, stating which were actually run in this lesson and which were described from documentation only
- Explain why reporting the highest test-set score across many trained model configurations is the garden-of-forking-paths failure mode applied to model development, and state the fix precisely
Prerequisites
- Day 118 -- hypothesis tests, confidence intervals and multiple comparisons; this lesson reuses the from-scratch two-sample z-test built there and extends its Bonferroni section directly
- Day 117 -- sampling and the standard error, which every tolerance in this lesson's lab is derived from
- Day 119 -- the pre-registered analysis plan and the decision-relevance framing this lesson's triage exercise applies before any data is touched
- Day 133 -- building an EDA report; this lesson's exercise 9 builds the handoff object that report generator requires
- Week 18's pandas pipeline, referenced rather than re-derived: profiling, cleaning and the manifest that makes data trustworthy to explore
- A working python3 on your PATH; the lab needs the standard library plus NumPy, pandas and pytest
Why this matters
Load a dataset that has no real signal in it at all. Try a grouping. Try a subset. Try a different outcome column. Try another cut. After examining forty combinations, one comes back “significant at p < 0.05” — and it gets written up, with a plausible story attached, because a plausible story can be attached to anything. Run this experiment for real, as this lesson does, and the exact numbers land close to a formula you can write down before touching any data: twenty independent comparisons at alpha = 0.05 carry a 64.15% chance that at least one comes back significant by chance alone; forty carry 87.15%. Nobody p-hacked. Nobody cheated. Every individual test was computed correctly. This is what happens when chance gets enough tries.
That is the risk this lesson exists to manage, and it sits at the exact seam in the pipeline where the most expensive mistakes in applied statistics and applied machine learning are made. Day 133 taught you how to write the document that reports a finding — the arc, the captions, the so-what filter. This lesson is about the process that happens before the document exists: the investigative loop an analyst actually runs, question after question, look after look, and specifically how an honest analyst avoids fooling themselves while running it. If Day 133 is about communicating a finding well, Day 136 is about deserving to report one at all.
The stakes are not abstract. A team that explores a dashboard of forty metrics after a product launch and reports whichever one moved is not running a scientific process — it is running the exact simulation this lesson opens with, on real revenue. A machine learning team that tries a hundred architectures and hyperparameter combinations and reports the best test-set score is doing the identical thing with a different vocabulary, and the AI thread at the end of this lesson makes that connection precise: the reported score after a hundred configurations is the maximum of a hundred draws, not an unbiased estimate of what the model will do in production. Getting this wrong costs money, ships models that quietly underperform their reported benchmarks, and — worse than either — trains the people involved to trust dashboards that were never trustworthy in the first place.
By the end of this lesson you will be able to state, and defend with your own measured numbers, the sentence that this entire day exists to teach: a p-value is only meaningful if you can say how many things you looked at.
The idea in plain language
Exploring data and confirming a finding are two different jobs, and they need to be kept apart. Exploring is the part where you poke around, try things, follow hunches, and mostly find nothing — that is normal, not a sign you are doing it wrong. Confirming is the part where you take one specific idea, born from that poking around, and check it against data you have not touched yet. The trouble starts when the two get merged: when the poking-around itself gets reported as if it were a confirmed finding, with no acknowledgment that you tried dozens of other things that did not pan out.
The fix that this lesson builds, piece by piece, is not a smarter statistical test. It is a discipline: hold out a confirmation set at the start of the work, before you have any hypothesis, and do not touch it until you do. Explore as freely as you like on the rest of the data. When something looks interesting, write it down as a specific, falsifiable claim, and then — only then — check it against the untouched set. A finding that survives is worth reporting. A finding that does not survive was a shape in the noise, and you are lucky to have found that out before anyone else did.
Underneath that discipline sits a second, quieter one: keep a log. Every question you asked, what you looked at to answer it, and what you found — including the times you found nothing. Most looks will produce nothing; that is the normal texture of exploratory work, and a log that only records the interesting parts cannot tell you, or anyone else, how many things you actually tried. Without that count, no correction and no amount of care can rescue a p-value’s honesty, because the question “how surprising is this?” cannot be answered without also answering “out of how many chances did this happen?”
Historical background
The tension between exploring data and confirming a hypothesis is as old as modern statistics itself, but it sharpened into a named methodological concern in a specific place: John Tukey’s 1977 book Exploratory Data Analysis formally separated the discipline of looking at data to generate hypotheses (which he called EDA) from the discipline of testing a pre-specified hypothesis against new data (confirmatory data analysis). Tukey’s own phrase for the danger of skipping that separation — using the same data to both generate and test a hypothesis — became a durable warning in the field: you cannot use a dataset to ask a question and then use the same dataset to answer it with a straight face.
The multiple-comparisons problem that this lesson quantifies has an older lineage still. Carlo Emilio Bonferroni published the inequality that bears his name in 1936, and it was picked up by statisticians across the twentieth century as the standard, conservative fix for testing several hypotheses at once: divide your significance threshold by the number of tests, and the chance of any false positive across the whole family stays controlled. Day 118 built and measured this correction directly. What this lesson adds is the part statisticians have pointed out with increasing force since the 1990s and that reached a wide applied audience through papers like Simmons, Nelson, and Simonsohn’s 2011 “False- Positive Psychology,” which coined the phrase “researcher degrees of freedom” for exactly the choices exercise 4 of this lesson’s lab quantifies: which subset, which outcome definition, which cutoff — every one a comparison, whether or not anyone called it a test. The related term “the garden of forking paths”, from Andrew Gelman and Eric Loken’s 2013 paper of the same name, names the deeper problem this lesson insists on stating plainly: in real exploratory analysis, the number of paths not taken is usually uncountable after the fact, which is exactly why Bonferroni’s honest, exact arithmetic cannot save you from a comparison count nobody kept.
What it is — and what it is not
The exploratory data analysis process is the disciplined cycle of asking a question of data, looking at an answer, and refining the question — carried out with an explicit boundary between the data you are allowed to poke around in and the data you are saving to check whatever you eventually decide to believe.
It is not the same thing as an EDA report (Day 133): the report is the finished document; the process is the work that decides what deserves to go in it. It is not the same thing as a hypothesis test in isolation (Day 118): a single, pre-registered test run once on fresh data needs no correction and no holdout, because there was only ever one comparison. It is not cleaning or profiling (Week 18): those make the data trustworthy to look at; this lesson is about what happens once you start looking. And it is not a excuse to avoid exploring: the loop described here explicitly expects and welcomes free, unpenalized poking-around — the discipline lives entirely in what you do after you find something, not in restraining yourself from looking in the first place.
Why it was created and what problems it solves
Two forces in real analytical work push in opposite directions, and the exploratory process exists to reconcile them. The first force: you need to explore, because you rarely know the right question before you have looked at the data — that is the entire reason Tukey separated EDA out as its own discipline rather than treating all analysis as confirmatory. The second force: every look you take is a chance for noise to hand you something that looks real. Left unmanaged, those two forces combine into the failure mode this lesson opens with — exploration mistaken for confirmation — and that failure mode is not rare or exotic. It is the default outcome of doing careful, honest, competent exploratory work and then reporting the results the same way you would report a single pre-registered test.
The process this lesson teaches solves three concrete problems at once. It makes the comparison count knowable (the research log), so a correction like Bonferroni has an honest number to work with. It gives you a mechanical check that does not depend on trusting your own memory of how careful you were (the confirmation set): if a finding cannot survive being tested on data it was never fitted to, no amount of a compelling story rescues it. And it gives you a way to decide when to stop that does not quietly depend on what you have found so far, which is the single easiest way for “we looked until we found something” to sneak into work that everyone involved would swear was done honestly.
How it works
The exploratory loop
The process is a cycle, not a line: ask a question, take a look, refine the question — repeated as many times as the data and the clock allow. Most looks produce nothing. That is not failure; it is the normal texture of the work, and a process that expects every look to find something is a process that will eventually manufacture a finding out of nothing just to avoid reporting an empty afternoon.
  ask a question
        |
        v
    take a look  ---->  (usually) nothing --> refine the question, repeat
        |
        v
 (occasionally) something interesting
        |
        v
   write it down as a specific, falsifiable claim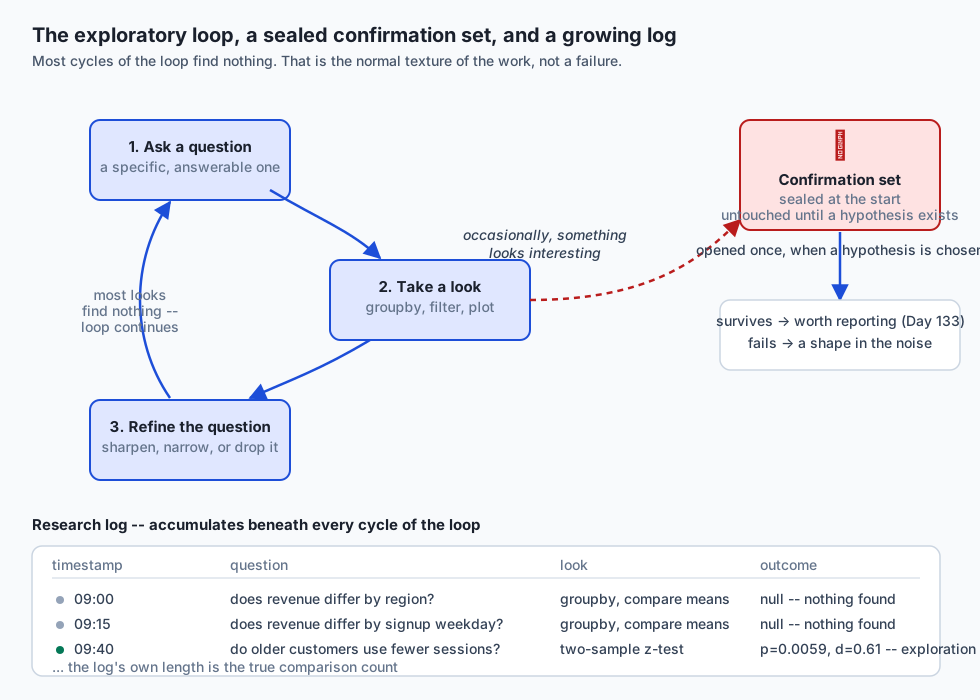
Exploration versus confirmation
The device that keeps exploration honest is mechanical, not psychological: split the data before you look at any of it. Put a confirmation set aside — 50/50 is a reasonable default, and this lesson’s lab uses it — and treat it as sealed. Explore freely on the rest. When you have a specific hypothesis, and only then, test it once against the confirmation set. This lesson’s lab exercise 3 makes this concrete on real data: one dataset carries a genuine, planted difference between two groups, and thirty columns with no true difference at all. Testing on the exploration half alone, the real effect looks significant (p = 6.661e-16) — and so, by chance, does the best of the thirty spurious columns (p = 0.0248), because with thirty candidates to choose from, chance usually hands you at least one that clears p < 0.05. Testing both again on the untouched confirmation half is where the two diverge: the real effect is still overwhelming (p = 2.056e-12), and the spurious one collapses to p = 0.9249 — nowhere near significant, because it never had anything real behind it. That divergence is the entire method in one comparison.
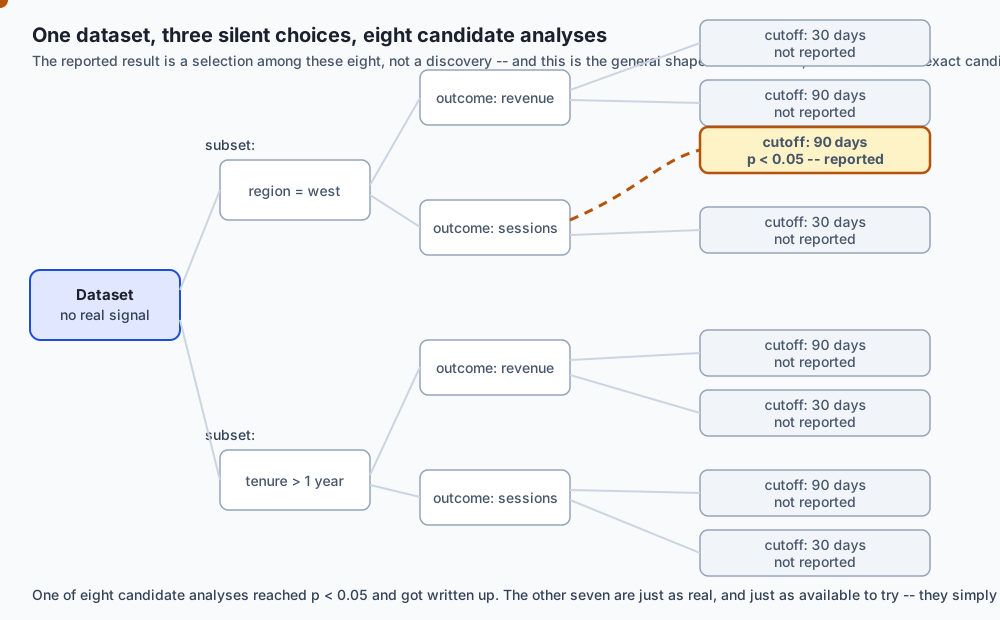
The forking-paths problem, beyond formal tests
Bonferroni-style corrections apply to tests you ran. The harder problem is that most of the choices an analyst makes are comparisons too, even when no test was ever run for them individually. Which subset of rows to include (customers from the last 30 days, or 90, or since launch?), which outcome to use (revenue, or revenue per session, or sessions?), which transformation and which cutoff — each one is a fork in the path, and the version of the analysis that got reported is the one fork, among many, that happened to look good. This lesson’s lab measures this directly: varying just a recency cutoff (five values) and an outcome definition (two variants) — ten silent variants, with no test formally declared for any of them — on data with no real signal, and reporting whichever cell looks best, comes back “significant” 24.8% of the time. One pre-declared comparison on the identical data comes back significant 5.1% of the time, matching the nominal 5% alpha almost exactly. Ten un-declared choices produced roughly five times the false-positive rate of one declared test. “I only ran one test” is not a defence if you tried five cutoffs and reported the one that worked.
Corrections and their honest limits
Bonferroni (Day 118) is exact arithmetic: divide alpha by the number of comparisons, m, and the family-wise false-positive rate falls back to near the nominal level — when m is known and correct. This lesson’s lab confirms that directly: with a known family of 20 comparisons, the corrected rate measures at 4.64%, close to the 5% target. The deeper problem, stated plainly rather than papered over: in real exploratory work, you usually cannot count your comparisons, because most of them were the silent choices described above, never logged as tests. Apply the identical correction — computed correctly for a reported count of 20 — to a search that actually ran 60 comparisons before landing on the 20 that got written down, and the real family-wise rate rises to 14.06%, nearly three times the nominal alpha, using a formula that is not wrong at all. The correction is exact; the number fed into it was not. A tool this precise deserves an honest input, and the honest input is what the next section builds.
The research log
The day’s practical deliverable is unglamorous and does the actual work:
a dated record of every question asked, what was looked at, and what
was found — including the nothings. Not a notebook of code cells (Day
133 already showed why a notebook is not a report), but a structured log
whose length is the comparison count. This lesson’s lab builds one as
a small data structure — a list of entries, each carrying a timestamp, a
description of the look, and an outcome, where None is a fully valid,
recorded outcome meaning “nothing found.” Re-running the forty-comparison
narrative scan from earlier through this log produces exactly 40 entries:
38 with a null outcome, 2 with a finding worth a second look. That
number, 40, is not an estimate or a recollection — it is len(log.entries),
and it is precisely the m that Bonferroni needs and that the earlier
section showed Bonferroni cannot function without.
Triage: deciding which questions are worth pursuing
Not every question deserves the same attention, and deciding this before touching data is itself part of the process. Day 119 framed the key question as “would the answer change a decision?” — this lesson turns that into a score: expected information, times decision relevance, divided by cost. A question that would teach you a great deal but ties to no live decision scores low on purpose; a cheap question tied to a decision being finalized this week outranks an expensive one that is merely interesting. This lesson’s lab ranks four realistic candidates and the ordering matches what a working analyst would actually choose: a cheap, high-relevance churn question beats a costlier but still relevant pricing question, which in turn beats a cheap but decision-irrelevant question about a button color, which beats an expensive, only moderately relevant full pipeline audit.
Stopping rules for exploration
Exploration has to end somewhere, and how it ends matters as much as how it starts. A time-boxed rule — a fixed budget of questions, or a fixed amount of clock time, asked and spent regardless of what turned up along the way — keeps the reported false-positive rate near the nominal alpha, because the decision about what gets reported was made before any data was seen. This lesson’s lab measures it directly: a fixed budget of 10 questions on data with no real signal, reporting only the pre-declared last one, comes back significant 5.05% of the time — almost exactly nominal. The honest opposite of a stopping rule is the sentence “we stopped when we found something” — asking up to the same budget of 10 questions and reporting the first one that crossed p < 0.05 — and that rule, on the identical budget of looks, reports a false positive 39.97% of the time. Eight times the nominal alpha, using the exact same amount of looking, differing only in when the decision to stop was made.
The handoff to Day 133
Exploration ends by choosing which few findings deserve a document, and everything this lesson built is what makes that choice defensible rather than asserted. This lesson’s lab closes by constructing the literal object that Day 133’s report generator needs: the finding itself, its result on the untouched confirmation set, and the comparison count the research log kept. Attempting to hand a report stage a finding with no confirmation result, or no comparison count, is refused with a named error — the same discipline Day 133’s generator already applies to a figure with no stated question. A report cannot honestly exist without these three things behind it, and building the refusal into code, rather than trusting an analyst to remember, is what turns “trust me, I checked” into something a reader can actually verify.
An everyday analogy
Think of exploration as browsing a used bookstore for something worth buying, and confirmation as actually reading the book before you commit to recommending it to a friend. Browsing is free and expected — you pick up dozens of books, skim a page, put most of them back, and that is not a wasted afternoon, it is how browsing works. The trouble starts if you skim one promising paragraph in one book and immediately text your friend “you have to read this, it’s incredible” — you have confused a five-second look with an actual recommendation, and if you had skimmed forty books that afternoon, the odds that at least one paragraph somewhere would sound incredible by chance were always high, independent of whether any of the books were actually good.
The fix is not to stop browsing — browsing is how you find the book worth reading in the first place. The fix is to notice the moment you go from “this looks interesting” to “I am telling someone this is good,” and to insist that between those two moments, you actually read the book: check it against something you have not already glanced at and been charmed by. A confirmation set is that second reading. A research log is the diary of every book you picked up, including the ones you put right back — so that when you finally do recommend one, you (and your friend) can see it was one recommendation out of forty tries, not the one book that happened to exist.
Examples in practice
A/B testing at a mid-sized product company. A growth team checks a dashboard of a dozen metrics after every launch and calls out whichever one moved. Applying this lesson’s process: the metrics dashboard is exploration, freely available; a specific, pre-registered primary metric (chosen before the launch, per Day 119) is the confirmation. The dashboard can and should be watched — that is real, useful exploration — but only the pre-registered metric’s result, checked once, gets reported as “this launch worked.”
A data science team investigating churn. An analyst notices, while poking around, that customers on the annual plan who signed up via a specific referral channel seem to churn less. Applying this lesson’s process: that observation goes in the research log with the twenty other things tried that afternoon, most of which found nothing. If a confirmation set — held out before any of this began — also shows the effect, it becomes a candidate for Day 133’s report, with its comparison count attached so a reader can judge how surprised to be.
A machine learning team choosing a model architecture. This is the AI thread made concrete early: trying a hundred architecture and hyperparameter combinations and reporting the highest test-set accuracy is running this lesson’s exact forking-paths simulation on a benchmark number. Applying the process means holding out a true, untouched test set (not the validation set the hundred trials were scored against), and reporting the untouched test set’s score for the one configuration chosen on the validation set — never the maximum across all hundred trials’ scores on any set that influenced the choice.
Implications: security, privacy, performance, scalability, and cost
Cost is where this lesson bites hardest in practice: a false “finding” that gets acted on — a pricing change, a feature rollout, a model shipped to production on an inflated benchmark — costs real money and real engineering time to build, and more to unwind once the effect fails to reproduce in production. The exploratory process is cheap insurance against a much more expensive mistake.
Performance and scalability matter in the mechanics: the lab’s forking-paths and stopping-rule simulations are deliberately vectorized with NumPy rather than looped in pure Python, because a research process that is too slow to run gets skipped under deadline pressure — and a skipped confirmation check is a confirmation check that never happened. None of the simulations in this lesson’s lab take more than a few seconds on ordinary hardware; that speed is a design choice, not an accident.
Privacy enters through the research log itself: a log that records every question asked of a dataset containing personal information is itself a record that may need governance — who can read it, how long it is retained — exactly the same as the data it describes. This lesson’s lab uses entirely synthetic data and does not address that governance layer; a real deployment of a research log against real user data would need to.
Security is a smaller but real concern: a research log that reveals which segments or subgroups an organization has scrutinized can itself leak sensitive strategic information (which customer segments are underperforming, which markets are being investigated) if it is not protected with the same access controls as the underlying data.
Alternatives: free, open source, and commercial
| Tool | When to choose it | How it’s used | Free vs. paid | Run in this lesson? |
|---|---|---|---|---|
| pandas + NumPy (scripts) | Default choice for any exploration that needs to be logged, tested, and re-run reliably; what this lesson’s lab is built on. | df.groupby(col)[outcome].mean() for a comparison; numpy.random.default_rng for every seeded simulation. | Free, open source (BSD 3-Clause), no account. | Yes — every number in this lesson came from a real run. |
Jupyter (with nbconvert) | The medium most analysts actually explore in day to day — fast iteration, inline plots, a natural home for the “ask, look, refine” loop. Day 139 installs and uses it directly in this course. | Cells run interactively; nbconvert --execute re-runs a notebook top to bottom to catch the out-of-order-execution hazard Day 126 named. | Free, open source (Project Jupyter), no account. | No — described from public documentation only; not installed for this lesson. |
statsmodels (statsmodels.stats.multitest) | Once your comparison count is known and logged, and you want Bonferroni, Holm, or a false-discovery-rate correction applied without hand-writing the arithmetic. | multipletests(pvals, alpha=0.05, method='bonferroni') returns which of a list of p-values survive correction. | Free, open source (BSD 3-Clause), no account. | No — described from its public documentation only, per its listing at statsmodels.org; not installed here (see the lab’s requirements/README.md). |
| Weights & Biases (or a similar experiment tracker) | Once exploration scales past what a plain text log can hold cleanly — many runs, many hyperparameters, needing to compare dozens of configurations visually. Directly relevant to the AI thread below: it is a research log, purpose-built for model development. | Logs each training run’s configuration and metrics automatically; its dashboard is a structured, queryable version of this lesson’s research log. | Documented as free for individuals and academic use, with paid tiers for teams and enterprise features — stated as its own public documentation states it, not run here. | No — described from public documentation only. |
The plain research log this lesson’s lab builds is the common ancestor of every row in that table: an experiment tracker is a research log with a UI and a database behind it; a notebook is an exploration medium with no built-in log at all, which is exactly why Day 133 warned against mistaking one for a report.
Comparison with related concepts
| Concept | What it governs | How it relates to this lesson |
|---|---|---|
| Hypothesis testing (Day 118) | A single, pre-registered comparison | This lesson is about everything that happens before you are entitled to run one test and trust its p-value at face value |
| Multiple comparisons correction (Day 118, extended here) | Adjusting alpha for a known number of tests | Exact and necessary, but only as honest as the comparison count fed into it — this lesson’s contribution is making that count knowable |
| The pre-registered analysis plan (Day 119) | Committing to a hypothesis and metric before seeing outcome data | The confirmation-set discipline in this lesson is the general case of Day 119’s specific plan: hold something back, decide first, check once |
| Data cleaning and profiling (Week 18) | Making the data trustworthy to look at | A prerequisite to exploration, not a substitute for it — clean data can still be explored dishonestly |
| The EDA report (Day 133) | Communicating a finding that has already survived confirmation | This lesson’s exit point: only findings with a confirmation-set result and a comparison count are eligible to become a Day 133 document |
| Cross-validation and a held-out test set (machine learning) | Estimating how a model will perform on unseen data | The exact same mechanism as the confirmation set, applied to model selection instead of a single hypothesis — see the AI thread |
When to use it — and when not to
Use the full process — confirmation set, research log, triage, an explicit stopping rule — whenever a finding might influence a real decision: a launch, a pricing change, a model going to production, a claim that will appear in a report someone else acts on. The cost of the discipline is small (a data split, a habit of logging) relative to the cost of acting on a false positive.
You do not need the full apparatus for genuinely low-stakes, throwaway curiosity: checking whether a column has any nulls, sanity- checking a join, looking at a distribution before deciding how to bucket it. Those are not findings and nobody is going to act on them as if they were — the discipline exists for the moment a look turns into a claim, not for every look you take on the way there. The judgment call is knowing which moment that is, and the honest answer is: the moment you would be tempted to write the finding down and show someone else.
Knowledge check
-
Twenty independent comparisons at alpha = 0.05, run on data with no real signal, come back with at least one “significant” result approximately how often?
- A) 64.15%
- B) 5%, the same as any single comparison
- C) 22.6%
- D) 100%, guaranteed
-
An analyst tries five subset filters and two outcome definitions, reports the single best-looking combination, and never formally declares a test for any of the ten variants. According to this lesson, is “I only ran one test” a valid defence?
- A) Yes, because no p-value was computed for the other nine
- B) No — each silent choice is a comparison, whether or not a test was declared for it
- C) Yes, as long as the winning result is significant at alpha = 0.05
- D) It depends on whether the outcome was pre-registered
-
A Bonferroni correction is applied using a reported comparison count of 20, but the analyst actually tried 60 comparisons before settling on the 20 that were written down. What happens to the true family-wise false-positive rate?
- A) It falls further below nominal, becoming overly conservative
- B) It becomes undefined
- C) It rises well above nominal, because the correction was applied to the wrong count
- D) It stays at the corrected nominal level, because the formula is exact
-
In this lesson’s centrepiece exercise, a real planted effect and the best of thirty spurious columns both look significant on the exploration half of the data. What distinguishes them on the untouched confirmation half?
- A) Both remain significant, because significance is a property of the data, not the split
- B) The spurious one becomes more significant, because more data resolves noise into signal
- C) Neither remains significant, because a holdout always erases real effects too
- D) The real effect remains significant; the spurious one does not
-
What is the primary purpose of a research log, as this lesson builds it?
- A) To make the true comparison count knowable, so a correction has an honest number to work with
- B) To document code for future maintainers
- C) To record only the findings worth reporting
- D) To satisfy a compliance requirement unrelated to the statistics
-
A time-boxed stopping rule (fixed budget of questions, reporting a pre-declared result) and a “stop when significant” rule are run on identical data with no real signal, using the identical budget of looks. What does this lesson’s measurement show?
- A) Both report a false positive near the nominal alpha
- B) The “stop when significant” rule reports several times more false positives than the time-boxed rule
- C) The time-boxed rule reports far more false positives, because it asks more questions
- D) Neither rule can be meaningfully compared without knowing the true effect size
-
In this lesson’s triage scoring (expected information x decision relevance / cost), why does a question about button color, which would teach the team something real, rank below a costlier pricing question?
- A) Button-color questions are inherently uninteresting
- B) Color-related metrics are always noisier than pricing metrics
- C) The button-color answer would not change any decision currently on the table, so its decision relevance is near zero
- D) The scoring formula penalizes any question with the word “color” in it
-
Why does this lesson describe reporting the highest test-set accuracy across a hundred trained model configurations as the same failure mode as the garden of forking paths?
- A) It is not the same failure mode — model selection is immune to multiple-comparisons problems
- B) Because training a hundred models always overfits the training data
- C) Because hyperparameter search requires a paid experiment tracker to be valid
- D) Because the reported score is the maximum of a hundred draws, not an unbiased estimate, unless a genuinely untouched test set is checked exactly once at the end
Hands-on exercise
Work through the nine exercises in
labs/sections/math-statistics-and-data/day-136-the-exploratory-data-analysis-process/.
Start with starter/00_brief.md, write your solutions in
starter/exploration.py, and check yourself continuously with
.venv/bin/pytest starter -q. The centrepiece is exercise 3: one dataset
with a real planted effect and thirty spurious columns, split before you
look at anything, where the real effect survives an untouched
confirmation set and the best-looking spurious column does not.
Expected output
An untouched checkout of pytest starter -q reports 1 passed, 13 skipped. Once every exercise is solved, it reports 14 passed. The full
harness, bash tests/run_tests.sh, ends with 33 checks, 0 failure(s).
and exits 0. Exercise 1’s script prints, among other lines:
k=20: exact = 1 - (1-0.05)^20 = 0.6415 simulated over 2000 families = 0.6595 deviation = 0.0180 (1.68 SE)Validate your work
Run bash tests/run_tests.sh; echo "exit=$?" from the lab directory and
confirm the final line reads 33 checks, 0 failure(s). with exit=0.
Separately, .venv/bin/pytest examples -q -p no:cacheprovider should
report 27 passed, confirming the reference implementation you are
checking your own work against is itself correct.
Troubleshooting
See troubleshooting.md in the lab directory for the full list. Two
worth knowing before you start: run every numbered script from inside
examples/ (they import dataset and exploration from beside
themselves), and a test that reports SKIPPED rather than FAILED means the
function it calls still raises NotImplementedError — that is normal
mid-exercise, not a bug.
Common mistakes
Selecting the “best” spurious column in exercise 3 using the full dataset (exploration and confirmation combined) rather than the exploration half alone — this silently leaks the confirmation set into the selection step and defeats the entire exercise. Treating the ten silent variants in exercise 4 as though Bonferroni should be applied to them directly — the point of that exercise is that nobody declared them as tests in the first place, which is exactly why the inflation is dangerous. And logging only the “interesting” findings in exercise 6, which makes the log’s length useless as a comparison count — the nulls are the majority of the record and the whole reason it is trustworthy.
Practice assignment
Take a dataset you have worked with before (or the narrative dataset this lesson’s lab builds, if you have none handy) and, without looking at any outcome data first, write down five real questions you would want to ask of it, each with a triage score (expected information, cost, decision relevance) using this lesson’s formula. Then split the data 50/50, answer your highest-scoring question on the exploration half, and check whatever you find against the confirmation half before you decide whether to believe it. Keep a research log the entire time, including every question that turned up nothing.
Extension challenge
Implement an alpha-spending sequential test — a stopping rule that lets you check results as data accumulates, the way a live dashboard actually gets watched, while keeping a formally guaranteed false-positive rate under repeated looking. Confirm by simulation, the same way this lesson’s lab exercise 8 does for the naive “stop when significant” rule, that your sequential test’s measured false-positive rate stays near its nominal target across many replications — and compare that measured rate directly against exercise 8’s two numbers (5.05% time-boxed, 39.97% stop-when- significant) to see exactly how much of the naive rule’s damage a principled sequential design actually recovers.
AI thread
Model development is exploration, wearing different clothes. Trying a hundred architectures, feature sets, and hyperparameter combinations and reporting the highest test-set score is not measuring how good the model is — it is measuring the maximum of a hundred draws, and this lesson’s exercise 1 shows exactly why that maximum runs high even when nothing underneath it is real: the more configurations you try, the more likely one of them looks great by chance on whatever data was used to choose it. The fix is the same fix, unchanged: a genuinely untouched test set, sealed before model selection begins, checked exactly once, with every configuration tried along the way recorded — not just the winner — so that anyone reading the final number can ask how many configurations produced it. A validation set used for early stopping, hyperparameter search, or architecture comparison has already been “explored”; only a test set that never influenced a single decision can play the role this lesson’s confirmation set plays, and the discipline of holding one out, sealed, until the very last check is not a formality borrowed from academic statistics — it is the only thing standing between a reported benchmark and a number that quietly will not reproduce in production.
Quiz
Q1. Twenty independent comparisons at alpha = 0.05, run on data with no real signal, come back with at least one "significant" result approximately how often?
- 64.15%
- 5%, the same as any single comparison
- 22.6%
- 100%, guaranteed
Show answer
Answer: A. 64.15%
The exact formula is 1 - (1 - 0.05)^20 = 0.6415, confirmed by simulation in this lesson's lab exercise 1. 22.6% is the corresponding figure for k=5 comparisons, not 20 -- the rate depends heavily on how many independent comparisons were actually tried, which is the whole point of the lesson.
Q2. An analyst tries five subset filters and two outcome definitions, reports the single best-looking combination, and never formally declares a test for any of the ten variants. According to this lesson, is "I only ran one test" a valid defence?
- Yes, because no p-value was computed for the other nine
- No -- each silent choice is a comparison, whether or not a test was declared for it
- Yes, as long as the winning result is significant at alpha = 0.05
- It depends on whether the outcome was pre-registered
Show answer
Answer: B. No -- each silent choice is a comparison, whether or not a test was declared for it
Exercise 4 measures this directly: ten silent variants with no test declared for any of them still inflated the apparent significance rate to roughly 24.8%, against about 5.1% for one pre-declared comparison on identical data. A choice IS a comparison, counted or not.
Q3. A Bonferroni correction is applied using a reported comparison count of 20, but the analyst actually tried 60 comparisons before settling on the 20 that were written down. What happens to the true family-wise false-positive rate?
- It falls further below nominal, becoming overly conservative
- It becomes undefined
- It rises well above nominal, because the correction was applied to the wrong count
- It stays at the corrected nominal level, because the formula is exact
Show answer
Answer: C. It rises well above nominal, because the correction was applied to the wrong count
Exercise 5 measures this: the correction restores the rate to about 4.64% when m=20 is correct, but the same corrected alpha applied to a true m=60 pushes the real rate to about 14.06% -- nearly three times nominal. The arithmetic is exact; the comparison count fed into it was wrong.
Q4. In this lesson's centrepiece exercise, a real planted effect and the best of thirty spurious columns both look significant on the exploration half of the data. What distinguishes them on the untouched confirmation half?
- Both remain significant, because significance is a property of the data, not the split
- The spurious one becomes more significant, because more data resolves noise into signal
- Neither remains significant, because a holdout always erases real effects too
- The real effect remains significant; the spurious one does not
Show answer
Answer: D. The real effect remains significant; the spurious one does not
The measured result: the real effect stays overwhelming (p around 2e-12) on confirmation, while the spurious column chosen for looking best on exploration collapses to p around 0.92 -- nowhere near significant, because it never had anything real behind it.
Q5. What is the primary purpose of a research log, as this lesson builds it?
- To make the true comparison count knowable, so a correction has an honest number to work with
- To document code for future maintainers
- To record only the findings worth reporting
- To satisfy a compliance requirement unrelated to the statistics
Show answer
Answer: A. To make the true comparison count knowable, so a correction has an honest number to work with
The log's length is exactly the comparison count -- not remembered or estimated afterward. Recording nulls (outcome = None) is essential: a log that only keeps the interesting entries cannot answer "how many things did you look at?" any better than memory can.
Q6. A time-boxed stopping rule (fixed budget of questions, reporting a pre-declared result) and a "stop when significant" rule are run on identical data with no real signal, using the identical budget of looks. What does this lesson's measurement show?
- Both report a false positive near the nominal alpha
- The "stop when significant" rule reports several times more false positives than the time-boxed rule
- The time-boxed rule reports far more false positives, because it asks more questions
- Neither rule can be meaningfully compared without knowing the true effect size
Show answer
Answer: B. The "stop when significant" rule reports several times more false positives than the time-boxed rule
Measured: the time-boxed rule lands at about 5.05% (near the nominal 5% alpha), while "stop when significant" on the identical ten-question budget lands at about 39.97% -- roughly eight times higher, because the stopping decision itself was made using the data.
Q7. In this lesson's triage scoring (expected information x decision relevance / cost), why does a question about button color, which would teach the team something real, rank below a costlier pricing question?
- Button-color questions are inherently uninteresting
- Color-related metrics are always noisier than pricing metrics
- The button-color answer would not change any decision currently on the table, so its decision relevance is near zero
- The scoring formula penalizes any question with the word "color" in it
Show answer
Answer: C. The button-color answer would not change any decision currently on the table, so its decision relevance is near zero
Day 119's framing: ask first whether the answer would change a decision, not only whether it would be interesting. High expected information with near-zero decision relevance still scores low, because the formula multiplies information by relevance before dividing by cost.
Q8. Why does this lesson describe reporting the highest test-set accuracy across a hundred trained model configurations as the same failure mode as the garden of forking paths?
- It is not the same failure mode -- model selection is immune to multiple-comparisons problems
- Because training a hundred models always overfits the training data
- Because hyperparameter search requires a paid experiment tracker to be valid
- Because the reported score is the maximum of a hundred draws, not an unbiased estimate, unless a genuinely untouched test set is checked exactly once at the end
Show answer
Answer: D. Because the reported score is the maximum of a hundred draws, not an unbiased estimate, unless a genuinely untouched test set is checked exactly once at the end
A validation set used for a hundred rounds of model selection has already been "explored" in this lesson's sense. Only a test set that never influenced a single decision, checked once at the very end, plays the role of this lesson's confirmation set -- the same discipline, applied to model development.
Glossary
- Exploratory data analysis (EDA)
- The discipline of looking at data to generate questions and hypotheses, as distinct from confirmatory data analysis, which tests a hypothesis already decided in advance. Named and formalized by John Tukey in his 1977 book of the same title.
- Confirmatory analysis
- Testing a specific, pre-declared hypothesis against data that was not used to generate that hypothesis. Confirmatory analysis is where a p-value can be taken at face value; exploratory analysis is where it usually cannot.
- Confirmation set (holdout)
- A portion of the data set aside before any exploration begins and left untouched until a specific hypothesis has been formed. Testing that hypothesis once against the confirmation set is what separates a real finding from a shape in the noise.
- Forking paths
- The set of all the different analyses -- different subsets, outcome definitions, cutoffs and transformations -- an analyst could plausibly have run on a given dataset. Coined by Andrew Gelman and Eric Loken (2013) to describe how the reported result is one path among many, chosen because it looked good, even when no formal test was declared for the paths not taken.
- Multiple comparisons problem
- The fact that running several independent hypothesis tests at a fixed significance level alpha raises the chance that at least one comes back "significant" by chance alone, well above alpha itself -- exactly 1 - (1 - alpha)^k for k independent tests.
- Family-wise error rate (FWER)
- The probability of at least one false positive across an entire family of comparisons, as opposed to the per-comparison error rate (alpha) of any single one. This is the rate a multiple-comparisons correction is designed to control.
- Bonferroni correction
- Dividing the significance threshold alpha by the number of comparisons, m, so that the family-wise error rate across all m tests stays near the original alpha. Exact and conservative when m is known and correct; useless when the true number of comparisons run exceeds the reported one.
- Researcher degrees of freedom
- The many small, often undeclared choices available during analysis -- which subset, which outcome, which cutoff, which transformation -- each of which is effectively a comparison, whether or not a formal test was run for it. Named by Simmons, Nelson and Simonsohn (2011).
- Research log
- A dated record of every question asked of a dataset, what was looked at to answer it, and what was found -- including outcomes of "nothing found." The log's own length is the true comparison count, which is what a multiple-comparisons correction needs to be honest.
- Triage (in exploration)
- Deciding which candidate questions are worth pursuing before spending time on any of them, typically weighing expected information, cost, and how much the answer would change a real decision.
- Stopping rule
- A rule, decided in advance, for when exploration ends -- for example a fixed time budget or a fixed count of questions. A stopping rule that depends on what has been found so far ("stop when significant") inflates the true false-positive rate well above the nominal alpha.
- Effect size (Cohen's d)
- A standardized measure of how large a difference is, expressed in units of pooled standard deviation, independent of sample size or the p-value's magnitude. A conventional rule of thumb (Cohen, 1988) treats d around 0.5 as the boundary between a "medium" and a "large" effect.
- Winner's curse (in this context)
- The tendency for a result selected because it looked best among many candidates to have both an inflated p-value's apparent extremity and an inflated effect size, simply because of the selection itself -- not because the underlying effect is actually that large.
- Handoff object
- In this lesson's lab, the structured record passed from the exploration stage to a report-writing stage (Day 133), required to carry a finding, its result on the confirmation set, and the number of comparisons run before it was chosen.
Sources and further reading
- statistics — Mathematical statistics functions — Python Software Foundation (accessed 2026-08-20)
- Random Generator (numpy.random) — NumPy Developers (accessed 2026-08-20)
- Statistics (statsmodels.stats) — statsmodels Developers (accessed 2026-08-20)
- Group by: split-apply-combine (pandas user guide) — pandas (NumFOCUS / pandas core team) (accessed 2026-08-20)
- Introduction to Probability (Grinstead and Snell) — Dartmouth College Mathematics Department (accessed 2026-08-20)
Kept in this browser, no account needed. Your progress page turns the whole record into one link you can bookmark or open on another device.