Math, Statistics, and Data › Working with Real Data › Day 140
Day 140: Section Project: An Exploratory Study
After this lesson you will be able to carry one question through the whole arc of a study -- question, provenance, ingestion, cleaning, exploration, statistics, visuals, report, limits -- and, more importantly, to check the seams between those stages rather than trusting them. Course 03 taught a dozen separable skills; a study is what happens when they have to hold each other up, and the failure mode of a capstone is never a single skill. It is a clean dataset with an unstated question, a beautiful chart of a leaked feature, a confident conclusion from an exploration that examined forty things: every component correct, the study worthless. You will run a worked miniature study end to end on a 264-row synthetic dataset -- 8 grain violations on arrival, four measured cleaning steps, 245 rows surviving, a 122/123 exploration and confirmation split, four logged looks, and a difference of 5.50 ug/m3 with a 95% interval of 3.80 to 7.21 that contains the planted truth of 6.00 -- and then you will build the artefact you keep: an acceptance harness. `check_study(path)` reads a study directory and returns a verdict of eight gates, each passing or carrying findings that name the file, the field, the cleaning step or the sentence at fault. You will prove it can fail on a real study, not only on fixtures, by deleting one required element from the complete worked study and watching exactly one gate fail by name. You will also be able to state why a study that peeked at its confirmation set is byte-identical to one that did not everywhere except its research log, why a checksum nobody recomputes is a decoration, and why every gate in Course 04 reappears under a different name.
Hands-on lab for this lesson
Lab files on GitHub: https://github.com/ai-roadmap-365/ai-roadmap-365.github.io/tree/main/labs/sections/math-statistics-and-data/day-140-section-project-an-exploratory-study
- Get the hands-on files. Clone the labs repository once (you can reuse this clone for every lesson). This works on macOS, Linux, and Windows (PowerShell or WSL):
git clone https://github.com/ai-roadmap-365/ai-roadmap-365.github.io.git cd ai-roadmap-365.github.io - Open this lesson's lab. Move into the directory for this specific day. Every lab lives at the same predictable path — section / subsection / week / day:
cd labs/sections/math-statistics-and-data/day-140-section-project-an-exploratory-study - Read the lab guide. Open `README.md` in that directory. It lists the exact commands, what each does, the expected output, and how to check your work — read it before running anything.
- Run it and check your work. Follow the README's "How to run" section: run the example first to see the finished result, then complete the numbered exercises in `starter/`, then run the tests. The tests pass (exit 0) only when your work is correct.
bash tests/run_tests.sh # or the test command named in the lab README
You can also open the lab as a local page (works offline, shows the file tree and expected output).
Learning objectives
By the end of this lesson you will be able to:
- Name the eight handoffs in a study and state, for each one, the artefact the stage before it owes the stage after
- Explain why a capstone fails at its seams rather than inside any stage, using the four-failure example this lesson opens with
- Build an acceptance harness whose verdict is a task list: every gate runs, and every finding names a file, field, step or sentence
- Fail a study whose question file is missing, empty, or records a topic rather than a question, naming the file each time
- Verify provenance by recomputing a recorded SHA-256 against the file it describes, and name each missing field individually
- Distinguish a grain that was declared from one that was checked, and record honestly that the contract failed on arrival
- Tell a damage report from a changelog, and fail a cleaning step documented without a before/after measurement
- Detect a study whose confirmation split was used during exploration by reading the research log's ordering -- the only place that failure leaves a trace
- Fail a reported estimate that carries no interval, and quote the offending sentence rather than naming the file
- Prove a study reproducible by rebuilding it and comparing bytes, and name the four decisions that make byte-identical figures possible
- Choose among Great Expectations, pandera, Frictionless Data, dbt tests, DVC, Quarto and a hand-written checker for a given verification task, stating which were actually run here and which were described from documentation only
- State what a harness cannot do -- it checks artefacts, never intentions -- and why that limit is what keeps it worth running
Prerequisites
- Day 119 -- analysing an experiment end to end, and the decision framing this study's question file records
- Day 134 -- finding data: licence, dictionary, checksum and retrieval record
- Day 135 -- from API to DataFrame, and the stated row grain this lesson asserts and checks
- Days 121 and 125 -- loading, inspecting and cleaning messy data; this day adds the measurement that turns a changelog into a damage report
- Day 126 -- a reproducible cleaning pipeline and the manifest this day's eighth gate verifies
- Day 133 -- building an EDA report, and the rule that every figure carries a question and a claim
- Day 136 -- the exploratory process, the research log, and the confirmation set sealed before any hypothesis exists
- Days 117 and 118 -- sampling, the standard error and the confidence interval; this day rebuilds the interval from math.erf alone
- Days 127 to 132 -- choosing the chart and chart honesty, applied to the worked study's two figures
- Day 138 -- data ethics, proxies and who is missing, which is what the report's limits section is made of
- A working python3 on your PATH; the lab needs NumPy, pandas, matplotlib and pytest
Why this matters
Here is a study. Read it the way its author’s manager read it, which is quickly, on a Thursday.
The data is clean. Every column is typed correctly, there are no nulls, the date range is complete, and the row count matches the source system exactly. The chart is beautiful — a well-chosen scatter with a fitted line, a colourblind-safe palette, an axis that starts at zero, a caption that says what it shows. The statistics are correct: the coefficient is reported with a 95% confidence interval, the interval excludes zero, and the p-value is genuinely below 0.05 for the test that was actually run. The code is on a branch, it runs top to bottom, and it produces the numbers in the report.
And the study is worthless. Not weak. Not preliminary. Worthless, in the specific sense that acting on it would be worse than acting on nothing, because the confidence it produces is unearned.
Here is why, and note that not one of these is a mistake inside a stage.
The question was written after the chart. The author started with a dataset and went looking, and the sentence at the top of the report — “we asked whether customers who use the mobile app churn less” — was typed on the morning of the deadline, after four days of looking at everything. It reads exactly like a question asked in advance. There is no way to tell from the document which it was.
The clean dataset was clean because the cleaning dropped 31% of the rows, and the rows it dropped were not random: they were the accounts with missing tenure, which are disproportionately the accounts that closed early, which are the churners. The cleaning script is correct. It does what it says. Nobody wrote down what it cost, so nobody noticed that the population in the report is not the population in the question.
The beautiful chart shows a feature that will not exist at prediction time. days_since_last_login is measured up to the point the account closed, so for a churned account it is small by construction. The chart is honest about what it plots. It is dishonest about what it implies, and the implication is the only reason anyone looked at it.
The confidence interval is correct for the test that was run, and the test that was run was the last of about forty. The other thirty-nine are not in the report, not because anyone hid them, but because nobody wrote them down as they happened and by Thursday nobody could have counted them.
Each component is correct. The study is worthless. That gap — between “every part is right” and “the whole is trustworthy” — is what today is about, and it is why a section project is the right shape for it. You cannot see any of those four failures from inside the stage where it happened. They live in the joins.
Course 03 taught a dozen separable skills across forty-two days: vectors and matrices, gradients, probability, sampling, intervals, pandas, cleaning pipelines, six kinds of chart, provenance, ingestion, exploration discipline, ethics. Every one of them was taught and tested on its own, because that is the only way to learn anything. Today they have to hold each other up.
The costs of getting the seams wrong land in four places, and they are worth naming before we build anything.
Decisions. A study exists because somebody will do something differently depending on the answer. A study that is wrong in a way nobody can see produces a decision made with false confidence, which is strictly worse than a decision made with acknowledged uncertainty — the second one gets hedged and monitored, the first one gets committed to.
Time, asymmetrically. Finding the leak in the churn study above took one engineer two hours, once somebody thought to look. Not finding it cost four months of a product roadmap. The cost of checking is small, fixed and paid up front. The cost of not checking is large, variable, and paid at the worst possible moment.
Compounding. A study is rarely the end of anything. Its numbers go into a slide, the slide goes into a plan, the plan gets referenced next year by somebody who was not in the room. And in the direction this course is heading, its dataset becomes a training set, and every unstated assumption in it becomes a property of a model.
Your own memory, which is the one people underestimate. Six months from now you will not remember whether you looked at the confirmation set. You will remember that you are the kind of person who would not have. Those are different facts, and only one of them is evidence.
So today builds two things. First, a small study carried all the way through, so you see the whole arc performed rather than described. Second — and this is the one you keep — an acceptance harness: a real, runnable checker that reads a study directory and reports what is missing or unsupported. It makes your own work gradeable by you, before anybody else sees it, and it turns “I think this is fine” into a verdict with named findings.
The idea in plain language
A study is nine stages and eight handoffs. The stages are things you already know how to do. The handoffs are the subject.
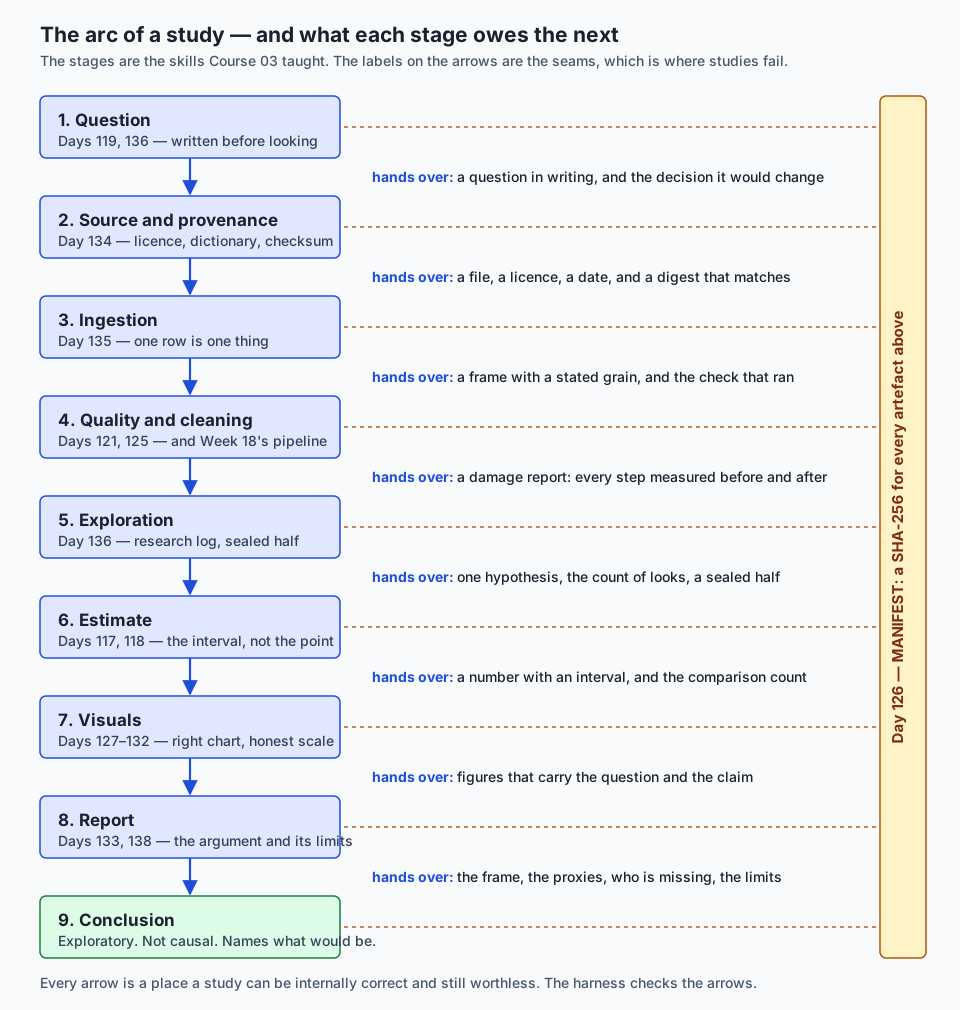
Read the left column and you have a list of skills. Read the right column and you have the study.
Each handoff is an artefact, not an intention. That distinction is the whole design. “I asked the question first” is an intention; QUESTION.md, with a modification time and content, is an artefact. “The cleaning was reasonable” is an intention; a damage report saying before: 264, after: 245 is an artefact. “I held out a confirmation set” is an intention; a research log whose confirmation row comes after the hypothesis row is an artefact.
Artefacts have a property intentions do not: a machine can check them. Not perfectly, and never for correctness — no program can tell you whether your question was worth asking. But it can tell you whether there is a question file at all, whether the source record has a checksum, whether every cleaning step carries a number, and whether the row in your log where you first touched the confirmation set comes before or after the row where you wrote your hypothesis down. Those four checks would have caught three of the four failures in the churn study.
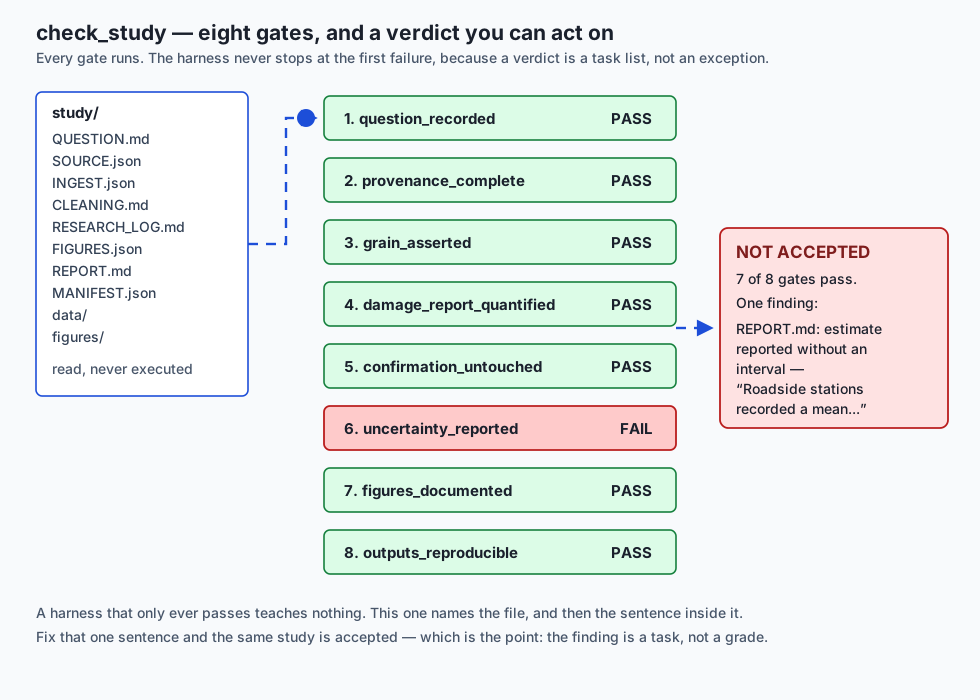
That is the harness. Eight gates, each one guarding one seam:
| Gate | The seam it guards | The failure it catches |
|---|---|---|
question_recorded | question → source | A search dressed up as an investigation |
provenance_complete | source → ingestion | A result nobody can re-obtain, including you |
grain_asserted | ingestion → cleaning | Every count downstream quietly wrong |
damage_report_quantified | cleaning → exploration | A different population than the question asked about |
confirmation_untouched | exploration → estimate | A p-value that means nothing |
uncertainty_reported | estimate → report | A number wearing the costume of a fact |
figures_documented | visuals → report | Decoration mistaken for evidence |
outputs_reproducible | pipeline → everything | A report nobody can regenerate, starting with you |
And one sentence to carry out of today, if you keep only one:
A study is only as good as its weakest handoff, and the handoffs are invisible from inside the stages.
Historical background
The split this whole day rests on — between looking at data and testing a claim about it — was named by John Tukey in Exploratory Data Analysis (Addison-Wesley, 1977). Tukey’s argument was not that exploration is inferior. It was that exploration is a different activity with different rules, and that pretending one is the other is where trouble starts. He was arguing partly against a statistical culture that had, in his view, over-invested in confirmatory machinery and under-invested in the messy, essential business of finding out what is in the data at all.
The confirmatory half of that pair has an older and sharper origin. Ronald Fisher’s The Design of Experiments (1935) is where the modern insistence on specifying an analysis in advance is set out most influentially, along with the observation — in the famous lady-tasting-tea example that opens the book — that what you can conclude depends entirely on what you committed to before the data arrived.
The reproducibility half arrives much later and from an unexpected direction: geophysics. Jon Claerbout and his Stanford Exploration Project spent the late 1980s and early 1990s insisting that a published result should ship with the code and data that produced it, and built the tooling to make their own papers rebuild from source. Jonathan Buckheit and David Donoho carried the idea into the statistics literature in 1995 with WaveLab and Reproducible Research, whose summary of Claerbout’s position — that an article is advertising, and the actual scholarship is the full software environment that produced the figures — is still the sharpest one-sentence statement of the idea.
Two 2005-to-2015 papers turned all of this from a methodological preference into a crisis with a name. John Ioannidis published Why Most Published Research Findings Are False in PLoS Medicine in 2005, arguing from the arithmetic of prior probability, power and researcher flexibility. Andrew Gelman and Eric Loken named the specific mechanism in The Garden of Forking Paths (American Scientist, 2014): an analyst need not run many tests to inflate their false-positive rate, only to have chosen among many analyses in a way that depended on the data. And the Open Science Collaboration’s Estimating the Reproducibility of Psychological Science (Science, 2015) attempted direct replications of 100 published studies and found that a substantial majority of the replications produced weaker effects than the originals. Day 136 built the simulation that shows why.
The provenance half has its own lineage. The FAIR Guiding Principles — Findable, Accessible, Interoperable, Reusable — were published by Mark Wilkinson and a large group of co-authors in Scientific Data in 2016, and are now the vocabulary most research funders use when they ask what happens to your data. Timnit Gebru and colleagues proposed Datasheets for Datasets in 2018, published in Communications of the ACM in 2021: the argument that every dataset should ship with a standard document describing its motivation, composition, collection process and recommended uses, in the way an electronic component ships with a datasheet.
And the machinery underneath is older and more boring than any of it. make was written by Stuart Feldman at Bell Labs in 1976, and the idea that a build should be a declared graph of dependencies that regenerates from source is the direct ancestor of every reproducible-pipeline tool in this section. SHA-256 was published by NIST in FIPS 180-2 in 2002, and it is what turns “the file is the same” from a belief into a check.
Nothing in today’s lab is new. What is new is putting all of it in one directory and checking the joins.
What it is — and what it is not
A study, as this day means it, is a directory containing a question, the data that answers it, a record of everything done to that data, the answer with its uncertainty, and an honest statement of what the answer cannot support.
An acceptance harness is a program that reads such a directory and reports what is missing.
Both of those definitions deserve their negative space, because the confusions are expensive.
A study is not a notebook. A notebook is a medium — an excellent one, and Day 139 covered making one that restarts and runs clean. But a notebook has no opinion about whether you wrote your question down, and its linear appearance actively conceals the order in which its cells were actually run. A study can be delivered as a notebook. It is not the same thing as one.
A study is not a dashboard. A dashboard answers a question repeatedly for many people over time. A study answers one question once, with an argument attached. The two have almost opposite failure modes: a dashboard fails by going stale, a study fails by being unrepeatable.
A study is not a model. This matters more from tomorrow onward than it does today. A model predicts; a study explains, or fails honestly to. You will spend Course 04 building models, and a great many of the failures in that course are today’s failures with different vocabulary — a leaked feature, an unstated grain, a test set that was looked at.
An acceptance harness is not a data-validation library. Great Expectations and pandera check values — this column is non-null, that one is between 0 and 100. Enormously useful, covered below in Alternatives, and completely orthogonal to what today’s harness does. A dataset can pass every value check ever written and belong to a study with no question in it.
An acceptance harness is not peer review, and it is not a substitute for a reader. It checks presence, not quality. uncertainty_reported cannot tell you whether your interval is correctly computed. It can tell you there is one. That is a much smaller claim, and it is precisely the kind of claim a machine can actually make.
And a harness is not a grade. Every finding it produces is a task with a location. The right emotional response to NOT ACCEPTED is not shame; it is opening the named file.
The distinction that matters most, as a table, because the left column is what most people deliver and the right column is what the word ought to mean:
| An analysis | A study |
|---|---|
| Starts with a dataset | Starts with a question, written down, with the decision it informs |
| Cites the data by name | Records the URL, retrieval date, licence, dictionary and checksum |
| Reads the file | States what one row is, and checks it |
| Cleans the data | Reports what cleaning changed, measured before and after |
| Explores until something turns up | Logs every look, and holds a confirmation set sealed until a hypothesis exists |
| Reports the estimate | Reports the interval, and how many things were looked at first |
| Includes charts | Includes figures, each carrying its question and its claim |
| Ran once, on the author’s machine | Regenerates byte for byte, with a manifest to prove it |
| Concludes | Concludes, and names what it cannot support and what would |
Why it was created and what problems it solves
Every gate in the harness exists because a specific, common failure gets past every other check. Taking them one at a time.
A written question exists because the alternative is undetectable. There is no way to look at a finished report and tell whether the question preceded the analysis. None. The document reads identically either way, which is exactly why the discipline has to be procedural rather than editorial. Writing the question to a file before opening the data is a small, cheap, checkable act that makes the honest version distinguishable from the dishonest one — mainly to yourself.
Provenance exists because “the data from the ops team” is not a source. Six months later the ops team has restructured, the file has been regenerated, the column you relied on has been renamed, and there is no way to establish which version you used. A URL, a retrieval date, a licence and a SHA-256 turn a reference into a recoverable fact. The licence is not paperwork, either: it decides whether your study can be published, shared, or built on.
A stated grain exists because every aggregate depends on it. “One row is one order” and “one row is one order line” differ by a factor that varies per order, and a sum computed under the wrong assumption is not approximately right — it is wrong by an amount you cannot bound. The worked study in today’s lab has a raw delivery where eight readings arrive twice, byte-identical, and every mean computed before de-duplication is quietly biased toward those eight stations.
A damage report exists because cleaning changes the population. This is the single most under-reported thing in applied data work. A changelog says “dropped rows with missing tenure”. A damage report says “rows with missing tenure: before 12,410, after 0 — 31% of the delivery”, and a reader can immediately ask the question that matters: are those rows special? Without the number, nobody asks.
A sealed confirmation set exists because exploration generates hypotheses that fit noise. Day 136 measured this: twenty independent comparisons at alpha 0.05 on data with no real signal produce at least one “significant” result 64.15% of the time. The defence is to form the hypothesis on one half and test it once on a half you have not seen.
The interval exists because a point estimate compresses away the only thing a decision-maker needs. “5.5 higher” and “5.5 higher, interval 3.8 to 7.2” support different decisions. “5.5 higher, interval −2.1 to 13.1” supports a third, which is usually “collect more data”.
The comparison count exists because a p-value without it is uninterpretable. Day 136’s sentence, worth repeating: a p-value is only meaningful if you can say how many things you looked at.
A question and a claim per figure exist because a chart is the most persuasive object in a report and the least examined. Readers absorb charts before they read prose. A figure that supports no stated claim is still doing persuasive work; it is just doing it unaccountably.
A manifest exists because “it reproduces” is a belief until somebody checks. A SHA-256 per output turns it into a two-second check — and, crucially, a check that fails loudly when someone edits a generated file by hand, which is how most “reproducible” pipelines actually die.
How it works
We build the harness in three passes: the smallest thing that could possibly work, then the shape of a real gate, then the eight gates themselves. Everything below is from today’s lab, which runs entirely offline on a 264-row synthetic dataset the lab ships.
The study directory
A study is a directory. Today’s layout, which the lab’s study.py writes and acceptance.py reads:
study/
├── QUESTION.md          the question, and the decision it informs
├── SOURCE.json          url, retrieved, licence, checksum, dictionary
├── INGEST.json          grain, grain_verified, rows_in, rows_out
├── CLEANING.md          the damage report, one measured step per heading
├── RESEARCH_LOG.md      every look, in order, with its split
├── FIGURES.json         one record per figure: file, question, claim
├── REPORT.md            the argument
├── MANIFEST.json        a SHA-256 for every generated file
├── data/observations.csv
└── figures/*.png
Nine names. That is the entire contract, and it is deliberately boring: any of these could be YAML, or front matter, or rows in a table. The lab uses JSON for the machine-readable ones only because json is in the standard library and no YAML parser is, so the harness carries no dependency the study does not already need. Every gate below works unchanged against a YAML study directory if you swap one function call.
Pass one: the smallest harness that is not useless
Before the eight gates, here is the whole idea in twelve lines. Build this yourself first; it teaches more than reading the finished version.
from pathlib import Path

REQUIRED = ["QUESTION.md", "SOURCE.json", "CLEANING.md", "REPORT.md"]

def check_study_v0(path):
    study = Path(path)
    missing = [name for name in REQUIRED if not (study / name).is_file()]
    return {"ok": not missing, "findings": [f"{n} is missing" for n in missing]}
That is genuinely useful. It catches the report with no question file, which is more studies than you would like. It also demonstrates the two properties every gate below keeps: it returns a value rather than raising, so all the checks run and you get a task list; and its findings name a file, so the output is actionable rather than atmospheric.
It has one fatal weakness, and noticing it is the point of the exercise: touch QUESTION.md defeats it entirely. Every real gate below is an answer to “and what would an empty file do?”
Pass two: the shape of a gate
The finished harness returns structured values, not dictionaries:
@dataclass(frozen=True)
class GateResult:
    name: str
    ok: bool
    findings: tuple[str, ...] = ()

@dataclass(frozen=True)
class StudyVerdict:
    path: str
    gates: tuple[GateResult, ...] = ()

    @property
    def ok(self):
        return all(gate.ok for gate in self.gates)

    @property
    def failed_gates(self):
        return tuple(gate.name for gate in self.gates if not gate.ok)
And one small guard that turns out to matter more than it looks:
def _failed(name, findings):
    findings = tuple(findings)
    if not findings:                       # a failing gate with nothing to say is a bug
        raise ValueError(f"gate {name!r} failed without a finding")
    return GateResult(name=name, ok=False, findings=findings)
That raise is not defensive programming; it is a design rule with teeth. It makes it impossible to write a gate that says “no” without saying why. Every checker you have ever ignored ignored you first, by reporting a failure you could not act on.
Gate 1 — the question was recorded
def gate_question_recorded(study_dir):
    text = _read_text(study_dir, "QUESTION.md")
    if text is None:
        return _failed("question_recorded", ["QUESTION.md is missing"])
    if not text.strip():
        return _failed("question_recorded", ["QUESTION.md is empty"])

    body = [line.strip() for line in text.splitlines()
            if line.strip() and not line.lstrip().startswith("#")]
    if not body:
        return _failed("question_recorded",
                       ["QUESTION.md contains only headings, no question text"])
    if not any(line.endswith("?") for line in body):
        return _failed("question_recorded",
                       ["QUESTION.md records no question sentence "
                        "(no non-heading line ends in a question mark)"])
    return _passed("question_recorded")
Four distinct failures, four distinct findings. The last one is the interesting one: it rejects # Question followed by “Air quality in the city network.” — a topic, not a question. That is the commonest real version of this failure and the hardest to notice in your own work, because a topic feels like a question when you already know what you meant by it.
What the gate cannot do is prove the question came first. Nothing can, from the artefacts alone. It insists on the weaker, checkable thing, and it is honest about the difference.
Gate 2 — provenance, verified rather than recorded
REQUIRED_SOURCE_FIELDS = ("url", "retrieved", "checksum_sha256", "licence")Each missing field gets its own finding — three missing fields produce three findings, not one summary. And then the part most implementations skip:
    recorded = payload.get("checksum_sha256")
    local = payload.get("path")
    if isinstance(local, str) and local.strip() and isinstance(recorded, str):
        local_path = study_dir / local.strip()
        if not local_path.is_file():
            findings.append(f"SOURCE.json: path {local.strip()} does not exist")
        elif sha256_of(local_path) != recorded.strip():
            findings.append(
                f"SOURCE.json: checksum_sha256 does not match {local.strip()}")
A checksum nobody verifies is a decoration. Recording a digest and never recomputing it gives you the aesthetic of rigour with none of the mechanism. The gate recomputes.
Gate 3 — the grain, asserted and honest
This is the gate where the worked study is most instructive, because the study’s grain assertion fails on arrival. Eight readings are delivered twice. INGEST.json says so:
{
  "grain": ["reading_id"],
  "grain_statement": "one row is one reading from one station",
  "grain_violations_on_arrival": 8,
  "resolved_by": "cleaning step 'drop duplicate reading_id rows'",
  "grain_verified": true,
  "rows_in": 264,
  "rows_out": 245
}
Both facts are recorded: the contract failed, and here is what resolved it. An earlier draft of the lab wrote INGEST.json before cleaning, grain_verified was false, and the harness correctly refused the study. The fix was to record both numbers honestly, not to move the assertion somewhere it would pass. That is a small decision that generalises: when a check fails, the temptation is always to relocate the check.
The gate requires three things — a non-empty grain list, a grain_verified key that is exactly True, and a rows_in count — and it distinguishes two failures that are usually conflated:
- no
grainat all: an ingestion that never says what a row is; - a
grainwith nograin_verified: a grain declared but never checked, which is a hope with a schema.
The second is far commoner and far more dangerous, because the declaration itself creates confidence.
Gate 4 — a damage report, not a changelog
The whole gate rests on one distinction, which is worth stating as a table because it is the most transferable idea in today’s lesson:
| A changelog entry | A damage report entry |
|---|---|
| ”normalised the station type casing” | distinct station_type values: before 8, after 2 |
| ”dropped duplicate readings” | rows: before 264, after 256 |
| ”removed sensor faults” | rows carrying the −1.0 fault sentinel: before 6, after 0 |
| ”handled missing values” | rows with a blank reading: before 5, after 0 |
| Tells you what somebody did | Tells you what it cost |
| Cannot be audited | Can be argued with |
The gate parses CLEANING.md, requires a before: and an after: number under every ### step heading, and fails a step that has neither, naming it:
CLEANING.md: cleaning step 'drop sensor fault sentinel readings' is a
changelog entry, not a damage report: no before or after measurement
It also fails a step whose before equals its after — a step that changed nothing measurable either did not need doing, or measured the wrong quantity. Both are worth knowing.
And note that the gate is per-step. One lapse produces one finding while the other three steps still pass. A checker that rejects a whole file for one defect trains you to run it less often.
Gate 5 — the confirmation set, checked by ordering
This is the hardest seam in the arc, and it has a property that makes it worth building carefully: it leaves no trace in the finished report.
A study that peeked at its held-out half during exploration and a study that did not produce identical reports. Same interval. Same p-value. Same figures. The lab proves this rather than asserting it — the test test_a_peeked_study_looks_identical_everywhere_except_the_log takes the honest study, rewrites only its research log to show an early peek, and asserts that REPORT.md, FIGURES.json, CLEANING.md and SOURCE.json are byte-identical between the two.
So the only evidence is order, and the only record of order is the log:
| seq | timestamp            | split        | activity                        |
| 1   | 2026-06-30T09:05:00Z | exploration  | distribution of pm25_ug_m3      |
| 2   | 2026-06-30T09:18:00Z | exploration  | pm25_ug_m3 split by station_type|
| 3   | 2026-06-30T09:31:00Z | exploration  | pm25_ug_m3 against humidity_pct |
| 4   | 2026-06-30T09:44:00Z | exploration  | pm25_ug_m3 by station_id        |
| 5   | 2026-06-30T09:52:00Z | none         | hypothesis declared             |
| 6   | 2026-06-30T10:07:00Z | confirmation | test the declared hypothesis    |
The gate finds the index of the first row whose activity contains “hypothesis declared”, finds the index of the first row whose split is confirmation, and fails when the second is not strictly after the first:
RESEARCH_LOG.md: the confirmation split was first used at entry 2 (check
whether the gap also shows up in the held-out half), before the hypothesis
was declared at entry 4 -- the held-out half was part of the exploration
It also fails a log with no confirmation entry at all (nothing was confirmed) and one that uses the confirmation split more than once — because a confirmation set tested twice is an exploration set with a better name.
Two honest limits. A log can be back-dated by anyone willing to lie to themselves; the gate raises the cost of self-deception without eliminating it. And a log with four entries where thirty looks happened is a false record, and no checker can know. Both of those are reasons the log has to be written as you go, which is a habit, not a feature.
Gate 6 — uncertainty in the prose
Days 117 and 118 built the interval. This gate checks it survived the trip into the report, which it usually does not: the analyst computes the CI, looks at it, decides the effect is real, and writes “roadside stations are 5.5 higher”.
The gate is a heuristic, and it says so. A sentence in the report’s Findings section is treated as an estimate if it contains a number and one of eleven estimate words (mean, average, median, difference, rate, estimate, higher, lower, increase, decrease, proportion). An estimate sentence must also carry interval evidence: a CI, a plus-or-minus, a bracketed range, an “x to y”, or a “between x and y”.
Two scoping decisions worth copying if you build something like this:
It reads the findings section only. A methods paragraph saying “the delivery carried 264 rows” is not a claim, and a checker that flags it teaches you to ignore the checker. Precision matters more than recall for a tool you have to keep wanting to run.
It names the sentence, not the file. On a twelve-page report, REPORT.md is a re-read; the quoted sentence is a fix:
REPORT.md: estimate reported without an interval -- "Roadside stations
recorded a mean PM2.5 5.50 ug/m3 higher than park stations."
An honest note about building this gate, because it is the most useful thing that happened while writing today’s lab. The first version flagged a sentence in the worked study’s own report — “the estimate is imprecise enough that a true difference anywhere between 3.80 and 7.21 ug/m3 would be consistent with what was seen”. That sentence states an interval perfectly well in words; “between x and y” simply was not in the pattern list. That was a genuine false positive in the checker, not a defect in the report, and the fix was to add the pattern to the checker with a comment explaining why — not to reword the report so the checker would stop complaining. Rewriting your work to please your tool is how a tool becomes a ritual.
Gate 7 — figures carry questions and claims
Day 133’s rule, mechanised. Each record in FIGURES.json needs a file that exists, a non-empty question and a non-empty claim:
{
  "file": "figures/fig-01-pm25-by-station-type.png",
  "question": "Do roadside and park readings occupy different ranges?",
  "claim": "Roadside readings sit higher, but the boxes overlap: this is a shift in centre, not two separate populations.",
  "chart": "box plot",
  "baseline": "y axis starts at zero; PM2.5 is a ratio quantity"
}
Then the gate checks the other direction, which is the half most implementations forget: every file under figures/ must appear in FIGURES.json. That catches the chart that survived three drafts because nobody remembered what it was for — and a chart nobody can justify is still doing persuasive work on the reader.
Note the claim on that figure. It is a box plot, not two bars, because the question is “are these distributions different” and a box plot shows spread and overlap rather than hiding both behind two bar heights. And the claim admits the overlap. Days 127 through 132 in one record: the right chart, an honest baseline, and a caption that says what the picture actually supports rather than what the author hoped it would.
The baseline field is doing real work. PM2.5 is a ratio quantity, so its axis starts at zero — which keeps the lie factor, Edward Tufte’s ratio in The Visual Display of Quantitative Information (1983) between the size of an effect as drawn and its size in the data, at 1. Truncate that baseline and the same honest numbers produce a picture of two separate worlds. The gate cannot check a lie factor; recording the baseline decision in the figure record at least makes it something a reviewer can disagree with.
Gate 8 — outputs still match their manifest
    for rel in sorted(entries):
        target = study_dir / rel
        if not target.is_file():
            findings.append(f"MANIFEST.json lists {rel}, which does not exist")
            continue
        if sha256_of(target) != entries[rel]:
            findings.append(f"{rel} does not match its manifest checksum ...")
Plus the reverse sweep — a file on disk the manifest never mentions — and a requirement that the manifest cover REPORT.md at all.
What makes this gate work is what happens on the study’s side, and it is worth listing because every item is a habit rather than a technique. The worked study rebuilds byte for byte, figures included, because:
- the as-of date is a parameter, not a clock reading;
- every random draw comes from a seeded
numpy.random.default_rng; - the report’s paragraphs are wrapped by
textwrap.fillat a fixed width, so the same numbers always produce the same bytes regardless of how the source string happened to be laid out; - figures are saved with
metadata={"Software": None}, which suppresses the matplotlib-version tag PNG writers add by default.
Remove any one of those four and the lab’s exercise 8 fails. Item 4 in particular is the kind of thing you discover only by trying, and it is why “it reproduces” should always be a measurement.
One honest caveat, recorded in the lab’s FIELDS.md: the two PNG digests are machine-dependent, because matplotlib rasterises text with whatever fonts and FreeType build it finds. Nothing in the lab asserts a PNG digest against a stored literal. What is asserted is the portable property — two builds on the same machine produce identical bytes — checked by rebuilding and comparing rather than by looking a value up.
The harness
def check_study(path):
    study_dir = Path(path)
    if not study_dir.is_dir():
        raise FileNotFoundError(f"not a study directory: {study_dir}")
    return StudyVerdict(
        path=str(study_dir),
        gates=tuple(gate(study_dir) for gate in GATES),
    )
Every gate always runs. A study missing its question file should still be told about its missing checksum, because the output is a task list and you would rather have all of it at once.
An everyday analogy
A house is finished. Four trades did the work, and all four did it well.
The electrician’s work is correct: every circuit tested, every socket earthed, the consumer unit labelled. The plasterer’s work is correct: flat, dry, no cracks. The joiner’s work is correct: doors hung true, the wardrobe fitted plumb and square. The decorator’s work is correct: two coats, clean lines, no drips.
And the socket is behind the wardrobe.
Nobody made a mistake. Every trade would pass an inspection of their own work, and each of them would be right to be annoyed at the suggestion they had not. The defect lives in the joins — in the fact that the electrician’s first-fix drawing and the joiner’s fitting schedule were never checked against each other, because checking the joins was nobody’s job.
That is what a snagging survey is for. The surveyor does not re-test the circuits or re-measure the plaster. They walk the building looking specifically at interfaces: does this door open fully, or does it foul the radiator? Is that socket reachable? Does the extractor vent to outside or into the loft? And they produce a snagging list — not a grade, not a pass mark, but a list of items, each naming a room and a defect. “Bedroom 2: socket obstructed by fitted wardrobe.”
Our harness is a snagging survey, and the mapping holds all the way down.
| The building | The study |
|---|---|
| Each trade’s own work | Each of Course 03’s skills, done correctly |
| Trade certificates | Your cleaning script running, your chart rendering |
| The joins between trades | The eight handoffs |
| The snagging survey | check_study(path) |
| A snag item naming a room and a defect | A finding naming a file and what is missing |
| The certificate withheld until snags are cleared | NOT ACCEPTED |
| Clearing a snag is a job, not a judgment | Fix the sentence, rerun, accepted |
Two places the analogy earns its keep by not being flattering.
A surveyor cannot tell you the house is beautiful, or that it was worth building in this location. They check that the thing works as a whole. Our harness cannot tell you your question was worth asking. It checks the joins.
And a surveyor who lists eighty snags on a good house gets ignored, and then the two that mattered get ignored with the rest. That is why gate 6 reads only the findings section, and why a step with a measurement is never flagged for the wording of its note. A checker’s precision is what buys its authority.
Examples in practice
The lab carries one small question through the whole arc, on a synthetic 264-row dataset of daily PM2.5 readings from eight fixed stations — four roadside, four in parks. The generator plants a true difference of 6.00 ug/m3 between the two types, and four deliberate defects: inconsistent casing in station_type, eight byte-identical redelivered readings, six readings carrying the sensor’s −1.0 fault sentinel, and five blanks.
The question, written before the file was opened. “Do roadside air-quality stations record higher PM2.5 than park stations, and by how much?” — with the decision it informs stated underneath, in Day 119’s framing: whether the next four stations widen roadside coverage or fill the park gaps.
Provenance. URL, retrieval date, CC0-1.0, a seven-column dictionary, and a SHA-256 the harness recomputes. The URL points at example.invalid, a name RFC 2606 reserves so it can never resolve, and the record carries a retrieval_note saying in plain words that the file is generated locally and never fetched. A provenance record that lies about where data came from would be a strange thing to put in a lesson about provenance.
Ingestion. Grain reading_id; 8 violations on arrival; resolved by cleaning; verified afterwards.
Cleaning, measured. Four steps, and the harness reads these numbers straight out of CLEANING.md:
| Step | Measure | Before | After |
|---|---|---|---|
normalise station_type casing | distinct values | 8 | 2 |
drop duplicate reading_id rows | rows | 264 | 256 |
| drop fault-sentinel readings | rows carrying −1.0 | 6 | 0 |
| drop rows with no reading | rows with a blank | 5 | 0 |
264 rows in, 245 out: 19 removed, 7.20% of the delivery.
The split, then the exploration. 122 readings to explore, 123 sealed. Four looks logged — a distribution, a split by station type, a check against humidity that found nothing, and a per-station breakdown. The one that found nothing is in the log, because the log’s length is the comparison count and a log that only records successes is a log that lies.
The estimate, on the confirmation half, once. Roadside minus park:
5.50 ug/m3 (95% CI 3.80 to 7.21, n=60 roadside and n=63 park readings)The interval contains the planted truth of 6.00, which is the sanity check a synthetic dataset buys you and real data never will. The comparison count — 4 — sits in the same paragraph, not in a footnote.
Two figures, both from the exploration half only, so no figure shows the data the estimate was measured on. A box plot with a zero baseline, whose claim admits the overlap; an overlapping histogram with common bins, whose claim is that neither distribution is driven by a subgroup.
The limits section, which is the part most reports skip and Day 138 exists for:
This study is exploratory. It does not establish that roadside siting causes higher PM2.5. Station siting is not randomised: the roadside units are where they are for reasons — traffic volume, building density, land availability — that are themselves plausible causes of the difference measured here.
The measured quantity is a proxy. PM2.5 at a fixed station is not what anyone breathes.
Who is missing: eight stations is a sample of sites, not of people. Neighbourhoods without a station contribute nothing, and stations are not sited at random, so the absence is not random either.
What would establish causation: an intervention — a road closure, a traffic-calming scheme, a low-emission zone boundary — with readings from the same stations before and after, and control stations outside the intervention area over the same period.
And then the harness, on that study:
ACCEPTED: <tmp>/study
[PASS] question_recorded
[PASS] provenance_complete
[PASS] grain_asserted
[PASS] damage_report_quantified
[PASS] confirmation_untouched
[PASS] uncertainty_reported
[PASS] figures_documented
[PASS] outputs_reproducible
And then — the part that matters — one required element removed. Delete checksum_sha256 from SOURCE.json. One line. The study is otherwise complete and unchanged:
NOT ACCEPTED
failed gates: ('provenance_complete',)
findings:     ('SOURCE.json is missing: checksum_sha256',)
Exactly one gate, exactly one finding, and it names the field. That is the difference between a harness that has been tested and one that has only ever been watched succeeding.
Implications: security, privacy, performance, scalability, and cost
Security. The harness is designed to be pointed at somebody else’s study, which makes that directory untrusted input. Two properties keep that safe, and both were design decisions rather than accidents. It reads and never executes: acceptance.py opens files, parses JSON, matches regular expressions and computes digests, and never imports or runs anything from the study. A study containing a hostile study.py is, to this harness, a file with a size. And malformed input produces a finding, not a crash: a SOURCE.json that is not valid JSON yields SOURCE.json is not valid JSON: .... The one deliberate exception is a path that is not a directory, which raises — a typo should stop you rather than quietly produce eight failures.
The one caution worth stating plainly: the reproducibility and figure gates walk the tree with rglob, so a study directory containing a symlink somewhere large or somewhere private gets followed the way any file walk follows it. Look at a directory before you point a walker at it.
Privacy. This is where a harness has an underappreciated second life. gate_provenance_complete requires a licence, and a licence is the field that decides whether your study can be shared at all. gate_damage_report_quantified makes it visible when cleaning removed a population — and the populations that get removed by “drop rows with missing fields” are systematically the ones with less complete records, which correlates with almost every kind of marginalisation you can name. Day 138’s argument, made mechanical: the damage report is where “who is missing” becomes a number instead of a worry.
Performance. Irrelevant, and that is a design property rather than a happy accident. The whole harness is file reads, regular expressions and SHA-256 over a handful of files. On the lab’s study it completes in milliseconds. Digesting a 500 MB dataset takes a second or two; hashing is fast and I/O-bound. If your harness is slow, you have accidentally made it re-run your analysis, and you will stop running it.
Scalability. Two directions. Across a team: the harness is a shared definition of “done”, and a shared definition of done is worth more than a style guide because it is executable. Across time: run it in CI on every study directory in a repository and a regression — someone hand-edited a generated report, someone removed a licence field — becomes a red build rather than a discovery.
Cost. Free, in every sense: no package outside the standard library, no service, no account. The real cost is the ten minutes each study spends writing QUESTION.md, logging looks as they happen, and recording before/after numbers. That is genuinely a cost and worth naming honestly, because a discipline that pretends to be free is a discipline people quietly abandon. Set against it: one leaked feature found before a roadmap is committed pays for a decade of ten-minute overheads.
Alternatives: free, open source, and commercial
Nothing here is a new idea; it is a small assembly of old ones. Here is the landscape, with what each tool is for, when to reach for it, and what it costs. Only pandas, NumPy, matplotlib and pytest were actually run for this lesson. Every tool below is described from its public documentation, and no output from any of them is reproduced anywhere in this day’s lesson or lab.
Great Expectations (free, open source, Apache-2.0; a commercial cloud offering exists). When to choose it: you need value-level data validation — column types, ranges, null rates, uniqueness — expressed declaratively and re-run on every batch, with a rendered report for non-engineers. How to use it: define expectations against a batch of data (expect_column_values_to_not_be_null, expect_column_values_to_be_between), group them into a suite, run a checkpoint. Concretely: our grain assertion is one expectation in its vocabulary — expect reading_id values to be unique. Free vs paid: the library is free and complete; the paid offering adds hosting, collaboration and alerting.
pandera (free, open source, MIT). When to choose it: you want the same value-level validation but as a schema attached to a DataFrame in Python code, with type hints and a decorator on the function that produces the frame — much lighter than Great Expectations and much closer to the code. How to use it: declare a DataFrameSchema with per-column checks, then schema.validate(df) or decorate the function. Concretely: pandera would express our whole INGEST.json contract as a schema object, including uniqueness of reading_id. Free vs paid: entirely free. Not installed on this machine; described from its documentation only.
Frictionless Data / Data Package (free, open source, MIT, from the Open Knowledge Foundation). When to choose it: you want a standard file describing a dataset — its resources, schema, licence and sources — rather than a bespoke SOURCE.json like ours. How to use it: write a datapackage.json beside your data and validate it with the frictionless CLI. Concretely: our SOURCE.json is a hand-rolled, less capable datapackage.json, and if you are sharing data outside your team you should prefer the standard. Free vs paid: free.
dbt tests (dbt Core is free and open source, Apache-2.0; dbt Cloud is commercial with a free tier). When to choose it: your transformations live in SQL against a warehouse rather than in pandas. How to use it: declare unique, not_null, accepted_values and relationships tests in a YAML schema file beside each model, then dbt test. Concretely: a unique test on reading_id is our grain assertion, expressed in the warehouse world. Free vs paid: the engine and the tests are free; the paid product adds scheduling, a UI and collaboration.
Datasheets for Datasets (a document standard, not software; free). When to choose it: you are publishing a dataset others will build on, and you want to answer the questions people will otherwise ask you individually — why it was collected, who is in it, who is not, what uses are inappropriate. How to use it: write the datasheet; several organisations publish templates. Concretely: our SOURCE.json dictionary plus the report’s limits section are a very small datasheet. Free vs paid: free.
DVC (free, open source, Apache-2.0; a commercial studio offering exists). When to choose it: your data files are too large for Git and you need versioned data alongside versioned code, with a declared pipeline that knows what is stale. How to use it: dvc add the data, define stages in dvc.yaml, dvc repro to rebuild what changed. Concretely: DVC’s stage graph plus its content-addressed cache does industrially what our MANIFEST.json does at toy scale. Free vs paid: the tool is free; hosted storage and the studio are paid.
Quarto and nbconvert (both free and open source; Quarto MIT, nbconvert BSD). When to choose it: your report should be rendered from the code that produced it, so the numbers in the prose cannot drift from the numbers in the analysis. How to use it: write the report with executable blocks and render it. Concretely: our REPORT.md is generated from the same run that produced the estimate, which is the same principle with less machinery. Day 139 covers the notebook side of this properly. Free vs paid: free.
Weights & Biases, Neptune, MLflow (MLflow is free and open source, Apache-2.0; W&B and Neptune are commercial with free tiers for individuals). When to choose it: you are running many analyses or many model configurations and want every run’s parameters, metrics and artefacts recorded automatically rather than by hand. How to use it: wrap the run, log parameters and metrics, browse the comparison. Concretely: our RESEARCH_LOG.md is a hand-written experiment tracker, and its advantage is that writing an entry costs you a moment’s thought about what you just did — which is exactly the reflection an automatic logger removes. Its disadvantage is that you can forget. Free vs paid: MLflow is free and self-hosted; the commercial tools state their own free-tier terms in their own documentation, and this lesson does not restate limits it did not verify.
seaborn (free, open source, BSD-3-Clause). When to choose it: you want statistical charts — a box plot, a violin, a faceted distribution — in one call rather than a dozen matplotlib lines, and you are happy for it to make good defaults on your behalf. Its documentation draws a useful distinction between figure-level functions, which own the whole figure and handle faceting and legends themselves, and axes-level functions, which draw into an axes you already have. Concretely: the worked study’s box plot would be one seaborn call. Why it is not used here: the study needs two simple charts and has to hash identically across two runs, and one fewer dependency is one fewer version to pin for that. Not installed in this lab’s environment; described from its documentation only, and no seaborn output is reproduced anywhere in this lesson. Free vs paid: free.
Plain pytest and a checker of your own (free, open source, MIT). When to choose it: your acceptance criteria are about the shape of a study rather than the values in a table — which is precisely today’s case, and which none of the tools above targets. How to use it: what the lab does. Free vs paid: free. This is the one that was actually run, and every number in this lesson came from it.
The honest summary: the value-validation tools are better than anything you will write, and you should use one. Nothing on that list checks whether you wrote your question down first, whether your cleaning reported its damage, or whether your log’s ordering shows a peek. That gap is small enough to fill in an afternoon and important enough to be worth filling.
Comparison with related concepts
| Concept | What it checks | What it cannot catch | Relationship to today |
|---|---|---|---|
| Data validation (Great Expectations, pandera) | Values: types, ranges, nulls, uniqueness | A perfectly valid dataset in a study with no question | Complementary. Our grain gate is the one place they overlap. |
| Unit tests | That your code does what you meant | That what you meant was the wrong analysis | Complementary. The lab has 54 of them, and they test the harness, not the study. |
| Acceptance testing (software) | That a delivered system meets stated criteria | Whether the criteria were the right ones | Direct ancestor. check_study is acceptance testing with the study as the deliverable. |
| Peer review | Judgment: is this argument sound, is this question worth asking | Presence of things a reader assumes are there | Complementary, and expensive. The harness clears the mechanical objections so review can spend its time on judgment. |
| A reproducibility check | That the outputs regenerate | Everything about whether the study was honest | One of our eight gates, not the whole job. |
| Pre-registration | That the analysis plan predates the data | Whether the plan was followed | Stronger than gate 1, because the timestamp is held by a third party. Gate 1 is its cheap local cousin. |
| A lab notebook | Nothing; it records | Anything you did not write down | Gate 5 reads exactly this artefact, which is why the habit matters more than the tool. |
The row worth dwelling on is pre-registration. Our question_recorded gate cannot prove ordering; a pre-registration held by a registry can, because the timestamp is not yours to edit. If you ever run a study whose result will be contested, use the stronger tool. For everything else — which is most work, most of the time — the cheap local version catches the failure that actually happens, which is not fraud but drift.
When to use it — and when not to
Use a study directory and a harness when:
- somebody will make a decision based on the result, and that decision is expensive to reverse;
- the work will outlive your memory of it, which is roughly six weeks;
- more than one person will touch it, including future you;
- the data has provenance worth recording — a licence, a retrieval date, a version;
- the result will be contested, or ought to be;
- the output feeds something downstream: a dashboard, a model, a published dataset.
Do not use it when:
- you are answering a question for yourself in the next four minutes and will not act on it;
- you are learning a tool, not producing a result;
- the “study” is one query whose answer is a single number that anyone can recompute in a second;
- the overhead would stop you doing the analysis at all. This is the real failure mode of process, and it is worth being blunt: a discipline nobody follows is worth less than a lighter one they do.
And scale it, rather than treating it as all-or-nothing. The gates are independent, which is a design property you should exploit. Two files — QUESTION.md and CLEANING.md — are perhaps fifteen minutes and catch two of the four failures in the churn study that opened this lesson. Add the research log when the exploration will take more than a day. Add the manifest when someone else will rerun it. A partial harness that runs is worth several complete ones that do not.
One more caution, because it is the way tools like this die. A harness is not a certificate. Every gate checks an artefact, not an intention. A log can be back-dated. A question can be written after the fact and dated before. A damage report can measure the wrong quantity precisely. What the harness does is raise the cost of self-deception and remove the excuse of forgetting. It does not make you honest; it makes it harder to be accidentally dishonest, which is the only kind most of us are.
Knowledge check
-
A study’s report, its figures and its confidence interval are byte-identical between an honest analysis and one that examined the confirmation set during exploration. Where does the difference show up?
- A) In the p-value, which is inflated by the peek
- B) In the ordering of entries in the research log, and nowhere else
- C) In the manifest checksums, which change when data is reused
- D) In the figures, because the peeked study’s charts include held-out data
-
What is the difference between a changelog entry and a damage report entry for a cleaning step?
- A) A damage report is written in prose; a changelog is a bulleted list
- B) A damage report names the function used; a changelog names the author
- C) A damage report carries a measurement of the quantity before and after; a changelog says what was done
- D) There is none — the two terms are used interchangeably
-
Today’s
INGEST.jsonrecordsgrain_violations_on_arrival: 8andgrain_verified: true. Why both?- A) Because the grain check is run twice for redundancy
- B) Because the raw delivery really did violate the grain, and hiding that would conceal the most consequential thing that happened to the data
- C) Because
grain_verifiedrefers to the columns andgrain_violations_on_arrivalrefers to the rows - D) Because the harness requires exactly two grain fields
-
Which failure would a value-level validation library such as Great Expectations or pandera not catch?
- A) A column containing nulls where the schema forbids them
- B) A
reading_idcolumn with duplicate values - C) A numeric column with values outside its declared range
- D) A complete, well-typed dataset belonging to a study whose question was written after the analysis
-
Why does the uncertainty gate scan only the report’s Findings section rather than the whole document?
- A) Because scanning the whole document is computationally expensive
- B) Because a methods paragraph mentioning a row count is not a claim, and a checker that flags it trains you to ignore the checker
- C) Because Markdown headings cannot be parsed reliably outside a known section
- D) Because the Findings section is the only part of a report readers look at
-
The
_failedhelper raisesValueErrorif you try to fail a gate with an empty findings list. What design rule is that enforcing?- A) That every gate must fail at most once per run
- B) That findings must be sorted alphabetically
- C) That a gate which says “no” must also say why, so the verdict is a task rather than a mood
- D) That failures must be logged before they are returned
-
The worked study rebuilds byte-identically, figures included. Which of these is not one of the four things that makes that true?
- A) The as-of date is a parameter rather than a clock reading
- B) Figures are saved with
metadata={"Software": None} - C) The report is wrapped by
textwrap.fillat a fixed width - D) The figures are rendered at a fixed DPI so their file size is constant
-
While building today’s uncertainty gate, it flagged a sentence in the worked study’s own report that did state an interval, in words. What was the right response?
- A) Reword the report so the checker stops complaining
- B) Remove the gate, since it produces false positives
- C) Add the missing pattern to the checker and record why, because the report was right and the checker was incomplete
- D) Lower the gate to a warning rather than a failure
Answers: 1 — B. The lab proves it: the peeked study’s REPORT.md, FIGURES.json, CLEANING.md and SOURCE.json are byte-identical to the honest study’s, which is exactly why the gate has to read the log’s ordering. 2 — C. “Dropped rows with missing tenure” tells you what somebody did; “before 12,410, after 0” tells you what it cost, and only the second lets a reader ask whether those rows were special. 3 — B. The delivery contained eight byte-identical redeliveries; the honest record says the contract failed on arrival and names the cleaning step that resolved it. An earlier draft moved the assertion to where it would pass, which is the temptation to resist. 4 — D. Value validators check values. Nothing in their vocabulary can express “there was a question, and it came first”. 5 — B. Precision buys authority; a checker that cries wolf on methods prose gets muted, and then its real findings get muted with it. 6 — C. A failure you cannot act on is a failure you will learn to ignore. 7 — D. DPI is fixed in the lab, but it is not one of the four determinism decisions; the fourth is that every random draw comes from a seeded generator. 8 — C. The report stated its interval in words (“anywhere between 3.80 and 7.21”); the pattern list was incomplete. Rewriting your work to please your tool is how a tool becomes a ritual.
Hands-on exercise
Build the acceptance harness. The lab ships a complete worked study and a set of deliberately broken copies of it; your job is the nine numbered exercises in starter/acceptance.py.
cd labs/sections/math-statistics-and-data/day-140-section-project-an-exploratory-study
python3 -m venv .venv
.venv/bin/pip install -r requirements/requirements.txt
Read starter/00_brief.md, then build the worked study and read what you are about to grade — ten minutes there saves an hour later:
.venv/bin/python3 -c "
import sys; sys.path.insert(0, 'starter')
import fixtures, pathlib
print(fixtures.worked_study(pathlib.Path('/tmp/day140-look')))
"
Then work through the nine exercises, checking yourself after each:
.venv/bin/pytest starter -qThe reference implementation and nine explanatory scripts are in examples/. Run them separately — never pytest examples starter as one command, because both directories carry modules of the same names and the combined form is unreliable:
.venv/bin/pytest examples -q
cd examples && ../.venv/bin/python3 09_whole_harness.py && cd ..
Expected output
pytest starter -q reports 1 passed, 32 skipped on an untouched checkout — one test always passes so that a green run is distinguishable from a collection error that ran nothing — and 33 passed once every exercise is solved.
pytest examples -q reports 54 passed.
The full harness, bash tests/run_tests.sh, ends with 81 checks, 0 failure(s).
09_whole_harness.py prints the accepted verdict on the worked study, then the same study with checksum_sha256 deleted from SOURCE.json, failing exactly one gate with exactly one finding, and ends:
OK: eight gates pass on the worked study, one deleted field fails
    exactly one gate by name, and three failures come back as three.
Validate your work
Run bash tests/run_tests.sh; echo "exit=$?" and confirm the last line reads 81 checks, 0 failure(s). with exit=0. Capture that exit status directly — never through a pipe such as bash tests/run_tests.sh | tail, because a pipeline reports the last command’s status and has hidden a real failure in this repository before.
Then prove the suite can go red, which is the only way to know a green run means anything: change "264" to "265" in the the delivery carries 264 rows check in tests/run_tests.sh, run it, see 81 checks, 1 failure(s). and a non-zero exit, and change it back.
Compare each script’s output against the matching file in expected-output/; they differ only in the temporary directory path. expected-output/FIELDS.md records exactly which captured values are identical everywhere and which are not — in this lab that list is unusually short, because nothing is sampled.
Troubleshooting
If pytest starter reports passes for exercises you have not written, you ran pytest examples starter as one command. Run them separately; a bare pytest with no path argument is fine, because each directory’s conftest.py guards its own imports.
If a gate you wrote skips instead of failing, it returned None — the test helper treats both NotImplementedError and None as “not attempted”. Every path through a gate must return a GateResult.
If _failed raises ValueError: gate '...' failed without a finding, that is deliberate: collect at least one finding before you fail.
If your gate passes the peeked study, it is reading REPORT.md. It cannot work — the peeked study’s report is byte-identical to the honest one, and the test asserts that before it checks your gate. Read the research log’s ordering.
troubleshooting.md in the lab covers the rest, including what to do when your figures stop hashing identically.
Common mistakes
Returning on the first problem. A gate that returns as soon as it finds a missing field reports one of three. Collect the findings, then decide.
Findings that name nothing. “Provenance incomplete” passes the “did it fail” test and fails the “does it name something” test, which is the one that matters. The exact strings the tests match are in the docstrings.
Checking existence instead of recomputing. Gate 8 must recompute each digest with sha256_of. A manifest whose files merely exist proves nothing at all.
Treating a declared grain as a verified one. grain present and grain_verified absent is the commonest real failure and the most dangerous, because the declaration itself creates confidence.
Rewording the study to please the checker. If a gate flags something correct, fix the gate and record why. That happened while building this lab — twice — and both times the checker was the thing that was wrong.
Practice assignment
Take a study directory you can get your hands on — one of your own from Weeks 15 to 19, a public analysis notebook, or a colleague’s — and run check_study against it. You will have to assemble the nine files from whatever exists, which is itself the assignment: the act of trying to fill in SOURCE.json from a notebook that says pd.read_csv("data.csv") is the lesson.
Write down, for each of the eight gates, one of three answers: passes, fails and here is the finding, or cannot tell, because the artefact does not exist in any form. That third category is the interesting one. Count how many of the eight you land in it.
Then add a ninth gate of your own, gate_decision_named, which requires QUESTION.md to state a decision the answer would change — Day 119’s test, mechanised. Run it against the same set of studies and see how many pass. Most analyses, honestly examined, cannot name the decision, and finding that out about your own past work is more useful than any amount of agreeing with this lesson.
Extension challenge
Extend the harness in the direction it is weakest: it checks presence, not consistency between artefacts.
Build gate_numbers_agree, which cross-checks the report against the records. Parse the row counts out of CLEANING.md’s damage report and confirm they match INGEST.json’s rows_in and rows_out. Parse the comparison count out of REPORT.md and confirm it equals the number of exploration rows in RESEARCH_LOG.md. Parse the figure filenames referenced in REPORT.md and confirm every one appears in FIGURES.json.
This is a genuinely harder gate than any of the eight, for a reason worth understanding before you start: the eight existing gates each read one artefact, so each can be wrong in only one way. A cross-checking gate reads two and must decide which one to believe when they disagree — and the honest answer is neither, because the disagreement itself is the finding.
Then run it against the worked study and see whether it passes. It should. Then change one number in study.py’s report template without changing the computation, rebuild, and watch it catch you — a drift between the prose and the code that no other gate in the harness can see, and the single commonest way a report becomes quietly untrue over its lifetime.
AI thread
Everything today is about to change vocabulary and stay exactly the same.
Course 04 starts tomorrow. In it, “cleaning” becomes preprocessing, “the confirmation set” becomes the test set, “the comparison count” becomes the number of hyperparameter configurations tried, and “the leaked feature” keeps its name because machine learning inherited the word directly. The failure modes do not change at all. They just get more expensive, because a model trained on a study’s worth of unstated assumptions does not sit in a slide deck being wrong — it sits in a system, making the same wrong decision several thousand times a day, in a form that is much harder to audit than a paragraph.
Three of today’s gates map onto machine learning so directly that you should carry them across without modification.
confirmation_untouched becomes the test set. Every failure Day 136 measured and today’s gate 5 detects applies unchanged to model development: report the best of a hundred configurations on the test set and you have run a hundred comparisons and reported one, exactly as if you had scanned a hundred columns for a correlation. The defence is identical — hold something out, use it once, record how many things you tried before you used it.
grain_asserted becomes the unit of prediction. A model trained on rows that are not what you think they are learns a relationship you did not intend. “One row is one customer” and “one row is one customer-month” produce different models with the same accuracy metric, and the metric will not tell you which you built.
damage_report_quantified becomes dataset documentation. The rows your preprocessing drops become the population your model has never seen, and the population it has never seen is the population it fails on. This is the mechanism behind a large share of documented fairness failures in deployed systems: not malice, not even biased labels, but a preprocessing step that removed the records that were least complete, which were systematically the records of the people least well served by whatever system produced them.
And there is a fourth connection that is less obvious and more immediate. You will increasingly produce analyses with the help of tools that generate code and prose quickly and fluently. Fluent output raises the value of every single artefact in today’s arc, because fluency is precisely the quality that makes an unfounded claim hard to spot by reading. A generated report can be beautifully argued, correctly formatted, statistically literate in tone, and describe an analysis that never happened. The defence is not to read harder. It is to check the artefacts: does a question file exist, does the checksum match the data, does the log’s ordering support the claim about the confirmation set, do the outputs regenerate. Those questions have answers that do not depend on how well the report is written.
That is the last idea of Course 03, and it is the right one to carry into Course 04. Trust is not something a document earns by reading well. It is something a study earns by being checkable — and the checking is a program you can run.
Quiz
Q1. A study's report, its figures and its confidence interval are byte-identical between an honest analysis and one that examined the confirmation set during exploration. Where does the difference show up?
- In the ordering of entries in the research log, and nowhere else
- In the p-value, which is inflated by the peek
- In the manifest checksums, which change when data is reused
- In the figures, because the peeked study's charts include held-out data
Show answer
Answer: A. In the ordering of entries in the research log, and nowhere else
This is not an argument, it is a measurement: the lab's test takes the honest study, rewrites only its research log to show an early peek, and asserts that REPORT.md, FIGURES.json, CLEANING.md and SOURCE.json are byte-identical between the two. The p-value is unchanged because the same test was run on the same data -- what changed is what the p-value MEANS, and that depends entirely on an ordering only the log records. This is why the gate reads the log and nothing else.
Q2. What separates a damage report entry from a changelog entry for a cleaning step?
- A damage report is written in prose; a changelog is a bulleted list
- A damage report names the function used; a changelog names the author
- A damage report carries a measurement of the quantity before and after; a changelog says what was done
- There is none -- the two terms are used interchangeably in practice
Show answer
Answer: C. A damage report carries a measurement of the quantity before and after; a changelog says what was done
"Dropped rows with missing tenure" tells you what somebody did. "Rows with missing tenure: before 12,410, after 0 -- 31% of the delivery" tells you what it cost, and a reader can immediately ask the question that matters: are those rows special? Without the number, nobody asks. The harness enforces exactly this by requiring a before and an after under every step heading, and it names the step that lacks them.
Q3. The worked study's INGEST.json records both `grain_violations_on_arrival: 8` and `grain_verified: true`. Why record both?
- Because the grain check is run twice for redundancy
- Because grain_verified describes the columns and grain_violations_on_arrival describes the rows
- Because the raw delivery really did violate the grain, and hiding that would conceal the most consequential thing that happened to the data
- Because the harness refuses any INGEST.json with fewer than two grain fields
Show answer
Answer: C. Because the raw delivery really did violate the grain, and hiding that would conceal the most consequential thing that happened to the data
Eight readings arrived twice, byte-identical, and every mean computed before de-duplication would have been biased toward those stations. The record says the contract failed on arrival, names the cleaning step that resolved it, and reports the verified result for the frame the study proceeds with. An earlier draft of this lab wrote INGEST.json before cleaning; the harness correctly refused the study, and the fix was to record both numbers rather than to move the assertion somewhere it would pass.
Q4. Which of these failures would a value-level validation library such as Great Expectations or pandera NOT catch?
- A column containing nulls where the schema forbids them
- A reading_id column with duplicate values
- A numeric column with values outside its declared range
- A complete, well-typed dataset belonging to a study whose question was written after the analysis
Show answer
Answer: D. A complete, well-typed dataset belonging to a study whose question was written after the analysis
Value validators check values, and they do it better than anything you will write by hand -- you should use one. But nothing in their vocabulary can express "there was a question, and it came first", or "the cleaning reported what it cost", or "the confirmation set was opened after the hypothesis". That gap is what today's harness fills, and the two are complementary rather than competing. The one genuine overlap is the grain assertion, which is a uniqueness expectation in either vocabulary.
Q5. Why does the uncertainty gate scan only the report's Findings section rather than the whole document?
- Because scanning a whole document is too slow to run on every save
- Because a methods paragraph mentioning a row count is not a claim, and a checker that flags it trains you to ignore the checker
- Because Markdown headings cannot be parsed reliably outside a known section
- Because the Findings section is the only part of a report that readers actually look at
Show answer
Answer: B. Because a methods paragraph mentioning a row count is not a claim, and a checker that flags it trains you to ignore the checker
Precision buys authority. A checker that cries wolf over "the delivery carried 264 rows" gets muted, and once it is muted its real findings are muted with it -- the same reason a snagging survey that lists eighty items on a good house gets ignored, along with the two that mattered. Scoping the gate narrowly is a deliberate trade of recall for the willingness to keep running it.
Q6. The harness's `_failed` helper raises ValueError if you try to fail a gate with an empty findings list. What design rule does that enforce?
- That every gate may fail at most once per run
- That findings must be returned in a stable, sorted order
- That a gate which says no must also say why, so the verdict is a task rather than a mood
- That failures must be written to a log before they are returned to the caller
Show answer
Answer: C. That a gate which says no must also say why, so the verdict is a task rather than a mood
Every checker you have ever ignored ignored you first, by reporting a failure you could not act on. "Provenance incomplete" is useless at 23:00 the night before a deadline; "SOURCE.json is missing: checksum_sha256" is a task with a location. Making the empty-findings case an exception rather than a convention means the rule cannot quietly erode as the harness grows.
Q7. The worked study rebuilds byte-identically across two runs, figures included. Which of these is NOT one of the four decisions that makes that true?
- The as-of date is a parameter rather than a clock reading
- Figures are saved with metadata Software set to None, suppressing the matplotlib version tag
- The report's paragraphs are wrapped by textwrap.fill at a fixed width
- The figures are rendered at a fixed DPI, which fixes their file size
Show answer
Answer: D. The figures are rendered at a fixed DPI, which fixes their file size
DPI is indeed fixed in the lab, but a fixed DPI does not make bytes deterministic -- two runs at the same DPI can still differ if anything upstream varies. The fourth decision is that every random draw comes from a seeded numpy.random.default_rng. The PNG metadata one is the least obvious and the most instructive: matplotlib writes its own version into the file by default, and that tag alone is enough to move the digest.
Q8. While building this lesson's uncertainty gate, it flagged a sentence in the worked study's own report that did state an interval -- in words, as "anywhere between 3.80 and 7.21". What was the right response?
- Reword the report so that the checker stops complaining
- Remove the gate, since a checker that produces false positives is worse than none
- Add the missing pattern to the checker and record why, because the report was right and the checker was incomplete
- Downgrade the gate from a failure to a warning
Show answer
Answer: C. Add the missing pattern to the checker and record why, because the report was right and the checker was incomplete
The report stated its interval perfectly well; "between x and y" simply was not in the pattern list. That was a genuine false positive in the tool, not a defect in the work, and the fix belongs in the tool -- with a comment saying why, so nobody removes it later. Rewriting your work to please your checker is how a checker stops being a check and becomes a ritual, and it is the commonest way verification tooling quietly loses its value.
Glossary
- Study
- As this lesson uses the word: a directory containing a written question, the data that answers it, a record of everything done to that data, the answer with its uncertainty, and an honest statement of what the answer cannot support. Distinct from a notebook (a medium), a dashboard (a repeated answer) and a model (a prediction).
- Seam (handoff)
- The interface between two stages of a study -- the artefact one stage owes the next. A study has nine stages and eight seams, and a capstone almost always fails at a seam rather than inside a stage, because a seam is invisible from within either stage it joins.
- Acceptance harness
- A program that reads a finished piece of work and reports what is missing or unsupported, returning a structured verdict rather than raising on the first problem. This day's harness, `check_study(path)`, runs eight gates over a study directory. It checks presence and consistency of artefacts, never the quality of the analysis.
- Gate
- One check in an acceptance harness, guarding one seam. A gate returns a result that is either a pass with no findings, or a failure with at least one finding that names a file, field, step or sentence. A failing gate with nothing to say is treated as a bug in the gate.
- Finding
- A single, actionable statement of what is wrong and where -- "SOURCE.json is missing: checksum_sha256", not "provenance incomplete". A verdict is a list of findings, which makes it a task list rather than a grade.
- Provenance
- The record of where data came from and under what terms: a URL, a retrieval date, a licence, a data dictionary and a cryptographic digest of the file as retrieved. Without it a result cannot be re-obtained by anyone, including its own author six months later.
- Grain
- The sentence "one row is one ___". The unit of observation a table is keyed on. Every aggregate depends on it, and a sum computed under the wrong grain is not approximately right but wrong by an amount you cannot bound. A grain that is declared but never verified is a hope with a schema.
- Damage report
- A record of what cleaning changed, measured: for each step, the quantity it affected, its value before and its value after. Distinct from a changelog, which records what was done. Only the measurement lets a reader ask whether the rows that were removed were special.
- Research log
- An ordered record of every look taken during exploration, including the ones that found nothing, each with a timestamp, the split it used and its outcome. Its length is the true comparison count, and its ordering is the only evidence that a confirmation set was opened after a hypothesis rather than before.
- Confirmation set
- A portion of the data set aside before any exploration begins and left untouched until a specific hypothesis has been formed, then tested once. A confirmation set tested more than once is an exploration set with a better name.
- Comparison count
- How many analyses were examined before the one being reported was chosen. It belongs in the same paragraph as the estimate, not in a footnote, because a p-value is only interpretable alongside it.
- Manifest
- A file recording a cryptographic digest -- here SHA-256 -- for every output a pipeline generates. It turns "it reproduces" from a belief into a two-second check, and it fails loudly when a generated file is edited by hand, which is how most reproducible pipelines actually die.
- Byte-identical rebuild
- The property that running a pipeline twice produces outputs whose bytes match exactly. It requires that nothing reads a clock, every random draw is seeded, text layout is computed rather than hand-wrapped, and image writers are told not to stamp their own version into the file.
- Lie factor
- Edward Tufte's ratio of the size of an effect as shown in a graphic to the size of the effect in the data. A truncated baseline on a ratio quantity inflates it; a chart designed to be honest keeps it at or near 1. Day 132's measure, applied here to the worked study's figures.
- Leaked feature
- A variable whose value could not have been known at the moment the prediction or comparison is meant to apply to -- for example, a "days since last login" measured up to the moment an account closed. The resulting chart or model is accurate about the past and useless about the future.
- Pre-registration
- Depositing an analysis plan with a third party before collecting or examining data, so that the ordering is attested by someone other than the analyst. Stronger than a locally written question file, because the timestamp is not yours to edit; the question file is its cheap local cousin, and it catches drift rather than fraud.
Sources and further reading
- User Guide (pandas) — pandas (NumFOCUS / pandas core team) (accessed 2026-08-20)
- Quick start guide (Matplotlib) — The Matplotlib development team (accessed 2026-08-20)
- hashlib — Secure hashes and message digests — Python Software Foundation (accessed 2026-08-20)
- Random Generator (numpy.random) — NumPy Developers (accessed 2026-08-20)
- Overview of seaborn plotting functions — Michael Waskom and the seaborn developers (accessed 2026-08-20)
Kept in this browser, no account needed. Your progress page turns the whole record into one link you can bookmark or open on another device.